Skip to content

2024

Exploring Generative Adversarial Networks (GANs) - The Power of Unsupervised Deep Learning

Welcome back to another episode of 'Continuous Improvement,' where we delve into the latest advancements in technology and their implications. I'm your host, Victor Leung. Today, we're exploring a fascinating and transformative technology in the field of artificial intelligence—Generative Adversarial Networks, commonly known as GANs.

GANs have revolutionized unsupervised deep learning since their introduction by Ian Goodfellow and his team in 2014. Described by AI pioneer Yann LeCun as 'the most exciting idea in AI in the last ten years,' GANs have found applications across various domains, from art and entertainment to healthcare and finance.

But what exactly are GANs, and why are they so impactful?"

At its core, a GAN consists of two neural networks—the generator and the discriminator—that engage in a dynamic and competitive process. The generator's role is to create synthetic data samples, while the discriminator evaluates these samples, distinguishing between real and fake data.

Here's how it works: The generator takes in random noise and transforms it into data samples, like images or time-series data. The discriminator then tries to determine whether each sample is real (from the actual dataset) or fake (created by the generator). Over time, through this adversarial process, the generator learns to produce increasingly realistic data, effectively capturing the target distribution of the training dataset."

This leads us to the exciting part—applications of GANs. Initially, GANs gained fame for their ability to generate incredibly realistic images. But their utility has expanded far beyond that. For instance, in the medical field, GANs have been used to generate synthetic time-series data, providing researchers with valuable datasets without compromising patient privacy.

In finance, GANs can simulate alternative asset price trajectories, helping in training machine learning algorithms and testing trading strategies. This capability is crucial for scenarios where real-world data is limited or expensive to obtain.

The creative possibilities are also remarkable. GANs can enhance image resolution, generate video sequences, blend images, and even translate images from one domain to another, like turning a photo into a painting or a sketch into a detailed image. This technology is not just about creating data—it's about transforming and understanding it in new ways."

Of course, no technology is without its challenges. GANs can be tricky to train, often requiring careful tuning to prevent issues like training instability or mode collapse, where the generator produces limited variations of data. Moreover, evaluating the quality of the generated data can be subjective, posing another challenge for researchers.

However, the future looks promising. Advances in GAN architectures, such as Deep Convolutional GANs (DCGANs) and Conditional GANs (cGANs), are already improving the stability and quality of generated data. As the field continues to evolve, we can expect even more robust and versatile applications of GANs.

In summary, GANs represent a groundbreaking leap in unsupervised deep learning. Their ability to generate high-quality synthetic data opens new possibilities in research, industry, and beyond. As we continue to explore and refine this technology, the potential for innovation is immense.

Thank you for joining me on this journey through the world of GANs. If you found today's episode insightful, don't forget to subscribe and share with others who might be interested. Until next time, keep pushing the boundaries of what's possible in the world of AI and technology. I'm Victor Leung, and this is 'Continuous Improvement.'

探索生成對抗網路(GANs)- 無監督深度學習的力量

生成對抗網路,常被稱為GANs,自2014年由Ian Goodfellow和他的同事發明以來,已經顛覆了無監督深度學習領域。Yann LeCun形容為"過去十年中人工智慧最激動人心的想法"的GANs,在各種領域取得了重要進展,為複雜問題提供了創新的解決方案。

什麼是GANs?

GANs由兩個類神經網絡組成,分別是生成器和判別器,進行競爭對抗的遊戲。生成器創建合成數據樣本,而判別器則評估這些樣本是真實的還是假的。隨著時間的推移,生成器提高了其產生與真實數據難以區分的數據的能力,有效地學習了訓練數據集的目標分佈。

GANs如何工作

  1. 生成器:該類神經網絡通過將隨機噪聲轉化為數據樣本來生成假數據。
  2. 判別器:該類神經網絡評估數據樣本,區分真實數據(來自訓練集)和假數據(由生成器產生)。

生成器的目標是欺騙判別器,而判別器則努力準確地識別出假數據。這種對抗過程持續進行,直到生成器產生高度真實的數據,判別器已無法區分出真實數據。

GANs的應用

儘管GANs最初因生成逼真圖像而聞名,但他們的應用已擴展到各種領域,包括:

醫療數據生成

Esteban, Hyland, 和 Rätsch (2017) 將GANs應用於醫療領域,生成合成的時序數據。這種方法有助於創建寶貴的數據集,供研究和分析使用,並不會侵犯患者隱私。

金融數據模擬

像Koshiyama, Firoozye 和 Treleaven (2019)這樣的研究人員探索了GANs在生成金融數據方面的潛力。GANs可以模擬替代資產價格軌跡,有助於訓練監督式或增強學習算法,並回測交易策略。

圖像和視頻生成

GANs已成功地生成高質量的圖像和視頻。應用包括:

  • 圖像超分辨率:增強圖像的分辨率。
  • 視頻生成:從圖像或文字描述創建逼真的視頻序列。
  • 圖像融合:融合多張圖像創建新圖像。
  • 人體姿態識別:分析和生成圖像中的人體姿勢。

域轉換

CycleGANs,是一種GAN,可以實現圖像到圖像的轉換,而不需要成對的訓練數據。這種技術被用於如將照片轉化為畫作或將圖像從一個域轉換到另一個域的任務。

文本到圖像生成

Stacked GANs(StackGANs)用文字描述生成與所提供描述匹配的圖像。這種能力在設計和內容創建等領域尤其有用。

時序數據合成

Recurrent GANs(RGANs)和 Recurrent Conditional GANs(RCGANs)專注於生成逼真的時序數據。這些模型在金融和醫療等領域具有潛在的應用,其中準確的時序數據至關重要。

GANs的優勢

GANs提供了一些優勢,使其成為機器學習中強大的工具:

  1. 高品質數據生成:GANs可以生成與真實數據極其相似的數據,這在獲取真實數據困難或昂貴的情況下非常寶貴。
  2. 無監督學習:GANs沒有標記數據的需求,降低了與數據標記相關的成本和工作量。
  3. 通用性:GANs可應用於各種類型的數據,包括圖像,視頻和時序數據,展示了其靈活性。

挑戰與未來方向

儘管GANs取得了成功,但也存在一些挑戰:

  1. 訓練不穩定:對抗訓練過程可能會變得不穩定,這需要對超參數和網絡架構進行謹慎的調整。
  2. 模式崩潰:生成器可能只會產生有限變化的數據,未能捕獲真實數據分佈的多樣性。
  3. 評估指標:評估生成數據質量仍是一個持續的挑戰,研究者正在探索各種指標來解決此問題。

未來的研究旨在解決這些挑戰,並進一步增強GAN的能力。像深度卷積GANs(DCGANs)和條件GANs(cGANs)這樣的架構改進已經在提高生成數據的穩定性和質量方面表現出了希望。

結論

生成對抗網絡在無監督深度學習中代表了突破性的創新。從生成逼真的圖像和視頻到合成寶貴的時序數據,GANs為研究和應用打開了新的途徑。隨著研究者繼續改進和擴大這種技術,GANs有望繼續保持在AI進步的最前線,為未來提供激動人心的可能性。

IVV

The trend for IVV is predicted to go up tomorrow.

Headlines

The latest headline concerning the iShares Core S&P 500 ETF (IVV) reports that the fund experienced a rise driven by positive market sentiment. Oppenheimer Asset Management has increased its year-end S&P 500 target to 5,900, reflecting a bullish outlook on the broader market. Additionally, the ETF has been highlighted for its performance, with specific analysis pointing to strong earnings growth in the S&P 500 for the second quarter of 2024, projected to rise by 8.1%.

Sentiment analysis

The increase in the year-end S&P 500 target to 5,900 by Oppenheimer Asset Management suggests a positive outlook for the broader market, which is beneficial for IVV in the short term.

NVDA

The trend for NVDA is predicted to go up tomorrow.

Headlines

The latest headline about NVIDIA Corporation (NVDA) is that the French competition authority has confirmed an investigation into NVIDIA. This investigation comes as NVIDIA continues to navigate competitive pressures and maintain its market position in the AI and semiconductor industries​.

Sentiment analysis

The impact of the investigation by the French competition authority on NVIDIA's stock price is uncertain and could depend on the investigation's findings and market perception.

QQQ

The trend for QQQ is predicted to go up tomorrow.

Headlines

The latest headline about the Invesco QQQ Trust (QQQ) highlights that the ETF has declared an increased quarterly dividend of $0.76 per share. This update represents a positive change from its previous quarterly dividend of $0.57 per share.

Sentiment analysis

Increasing dividends typically indicate strong financial health and can boost investor confidence in the short term.

TSLA

The trend for TSLA is predicted to go up tomorrow.

Headlines

The latest headline about Tesla (TSLA) stock indicates significant market movement. Tesla's stock has surged by around 7% as investors anticipate a key report on vehicle deliveries. Despite expected year-over-year declines in delivery numbers, investors are hopeful that Tesla might surpass these lowered expectations. Analysts have projected deliveries between 410,000 and 420,000 units for the second quarter, compared to 533,000 last year.

Sentiment analysis

Investor sentiment is mixed due to the anticipated year-over-year decline in deliveries despite the stock surge.

VOO

The trend for VOO is predicted to go up tomorrow.

Headlines

The latest headline regarding the Vanguard S&P 500 ETF (VOO) is that it reached a new 12-month high at $511.61. The fund has experienced consistent growth, reflecting its strong performance tracking the S&P 500 Index. Currently, VOO is trading at $514.55, marking a 0.62% increase​​​​. This upward trend is indicative of the overall bullish market sentiment and the continued popularity of low-cost, diversified investment options like VOO.

Sentiment analysis

The new 12-month high indicates strong performance and positive investor sentiment.

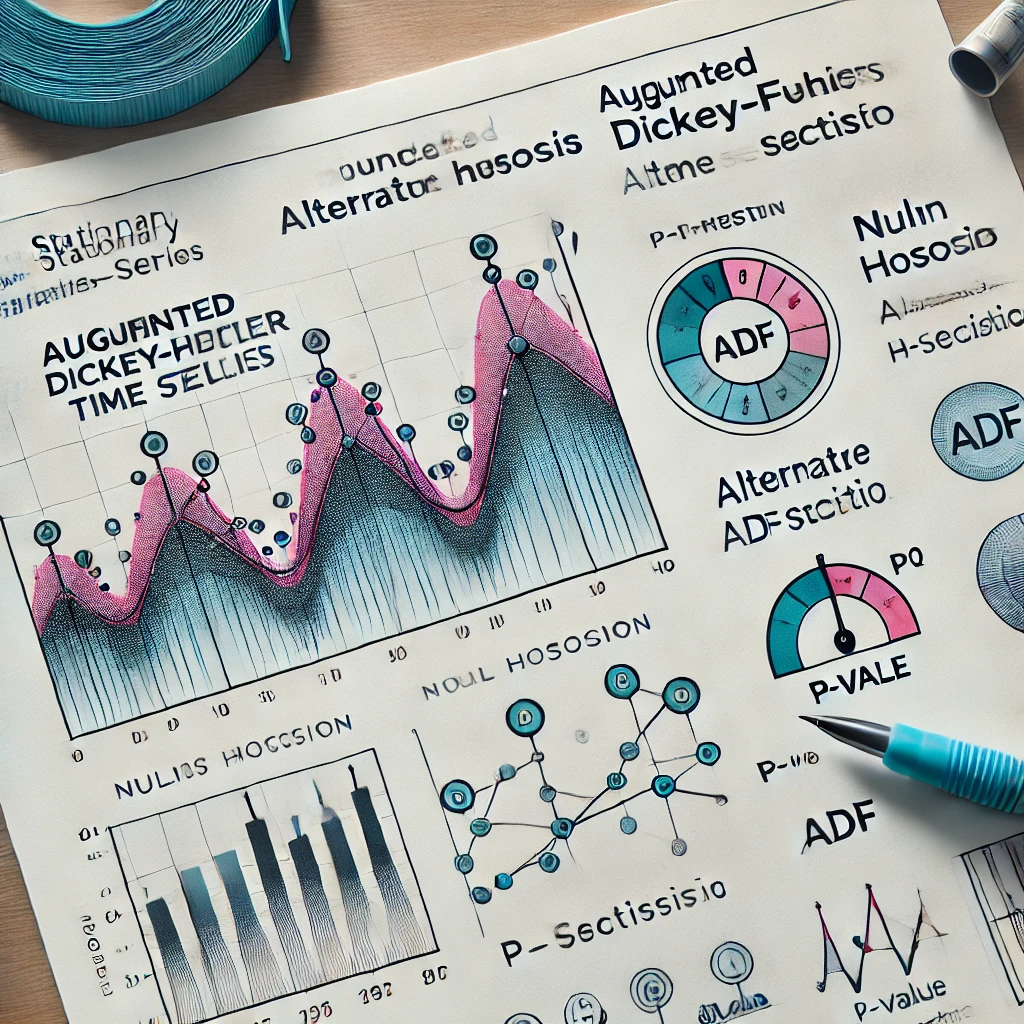
The Augmented Dickey—Fuller (ADF) Test for Stationarity

Stationarity is a fundamental concept in statistical analysis and machine learning, particularly when dealing with time series data. In simple terms, a time series is stationary if its statistical properties, such as mean and variance, remain constant over time. This constancy is crucial because many statistical models assume that the underlying data generating process does not change over time, simplifying analysis and prediction.

In real-world applications, such as finance, time series data often exhibit trends and varying volatility, making them non-stationary. Detecting and transforming non-stationary data into stationary data is therefore a critical step in time series analysis. One powerful tool for this purpose is the Augmented Dickey—Fuller (ADF) test.

What is the Augmented Dickey—Fuller (ADF) Test?

The ADF test is a statistical test used to determine whether a given time series is stationary or non-stationary. Specifically, it tests for the presence of a unit root in the data, which is indicative of non-stationarity. A unit root means that the time series has a stochastic trend, implying that its statistical properties change over time.

Hypothesis Testing in the ADF Test

The ADF test uses hypothesis testing to make inferences about the stationarity of a time series. Here’s a breakdown of the hypotheses involved:

  • Null Hypothesis (H0): The time series has a unit root, meaning it is non-stationary.
  • Alternative Hypothesis (H1): The time series does not have a unit root, meaning it is stationary.

To reject the null hypothesis and conclude that the time series is stationary, the p-value obtained from the ADF test must be less than a chosen significance level (commonly 5%).

Performing the ADF Test

Here’s how you can perform the ADF test in Python using the statsmodels library:

import pandas as pd
from statsmodels.tsa.stattools import adfuller

# Example time series data
data = pd.Series([your_time_series_data])

# Perform the ADF test
result = adfuller(data)

# Extract and display the results
adf_statistic = result[0]
p_value = result[1]
used_lag = result[2]
n_obs = result[3]
critical_values = result[4]

print(f'ADF Statistic: {adf_statistic}')
print(f'p-value: {p_value}')
print(f'Used Lag: {used_lag}')
print(f'Number of Observations: {n_obs}')
print('Critical Values:')
for key, value in critical_values.items():
    print(f'   {key}: {value}')

Interpreting the Results

  • ADF Statistic: A negative value, where more negative values indicate stronger evidence against the null hypothesis.
  • p-value: If the p-value is less than the significance level (e.g., 0.05), you reject the null hypothesis, indicating that the time series is stationary.
  • Critical Values: These values help to determine the threshold at different confidence levels (1%, 5%, 10%) to compare against the ADF statistic.

Example and Conclusion

Consider a financial time series data, such as daily stock prices. Applying the ADF test might reveal a p-value greater than 0.05, indicating non-stationarity. In such cases, data transformations like differencing or detrending might be necessary to achieve stationarity before applying further statistical models.

In summary, the ADF test is an essential tool for diagnosing the stationarity of a time series. By understanding and applying this test, analysts can better prepare their data for modeling, ensuring the validity and reliability of their results.

The Augmented Dickey—Fuller (ADF) Test for Stationarity

Welcome back to another episode of Continuous Improvement! I'm your host, Victor Leung, and today, we're diving into a crucial concept in statistical analysis and machine learning—stationarity, especially in the context of time series data. We'll explore what stationarity is, why it matters, and how we can test for it using the Augmented Dickey—Fuller (ADF) test. So, if you're dealing with financial data or any time series data, this episode is for you!

Stationarity is a key concept when working with time series data. Simply put, a time series is stationary if its statistical properties—like the mean and variance—do not change over time. This property is vital because many statistical models assume a stable underlying process, which makes analysis and predictions much simpler.

However, in real-world applications, especially in finance, data often shows trends and varying volatility, making it non-stationary. So, how do we deal with this? That's where the Augmented Dickey—Fuller, or ADF, test comes in.

The ADF test is a statistical tool used to determine whether a time series is stationary or not. Specifically, it tests for the presence of a unit root, a feature that indicates non-stationarity. A unit root implies that the series has a stochastic trend, meaning its statistical properties change over time.

The ADF test uses hypothesis testing to check for stationarity:

  • Null Hypothesis (H0): The time series has a unit root, which means it is non-stationary.
  • Alternative Hypothesis (H1): The time series does not have a unit root, indicating it is stationary.

To conclude that the series is stationary, the p-value obtained from the ADF test should be less than a chosen significance level, commonly set at 5%.

  • ADF Statistic: A more negative value indicates stronger evidence against the null hypothesis.
  • p-value: If this is less than 0.05, you reject the null hypothesis, indicating that the series is stationary.
  • Critical Values: These are thresholds for different confidence levels (1%, 5%, 10%) to compare against the ADF statistic.

In summary, the ADF test is a powerful tool for determining the stationarity of a time series. This step is crucial in preparing data for modeling, ensuring that your results are valid and reliable. Whether you're working with financial data, like daily stock prices, or any other time series, understanding and applying the ADF test can greatly enhance your analytical capabilities.

Thanks for tuning in to this episode of Continuous Improvement. Stay curious, keep learning, and join me next time as we explore more tools and techniques to enhance your data analysis skills. Until then, happy analyzing!

增廣迪基-富勒 (ADF) 站性檢定

站性是統計分析和機器學習中的基本概念,尤其是在處理時間序列數據時。簡單來說,一個時間序列若其統計屬性,例如均值和變異數,隨著時間保持常數,則該時間序列稱為站性。這種站性至關重要,因為許多統計模型假設生成數據的基礎過程不隨時間改變,這簡化了分析和預測。

在現實世界的應用中,例如金融,時間序列數據經常會呈現出趨勢和波動性,使它們非站性。因此,檢測並轉換非站性數據為站性數據是時間序列分析的關鍵步驟。增廣迪基—富勒(ADF)檢定是實現此目的的一項強大工具。

什麼是增廣迪基—富勒(ADF)檢定?

ADF檢定是一種統計檢定,用來確定給定的時間序列是站性還是非站性。特別地,它檢測數據中是否存在單根,這是非站性的指標。單根意味著時間序列有一個隨機趨勢,這意味著它的統計屬性會隨著時間改變。

ADF檢定中的假設檢定

ADF檢定使用假設檢定來對時間序列的站性進行推論。以下是這些假設的闡述:

  • 零假設 (H0):時間序列有單根,意即它為非站性。
  • 對立假設 (H1):時間序列沒有單根,意即它為站性。

為了拒絕零假設,並得出時間序列是站性的結論,從ADF檢定中獲得的 p 值必須小於所選的顯著性水平(通常為 5%)。

執行ADF檢定

以下是使用 statsmodels庫在Python中執行ADF檢定的方法:

import pandas as pd
from statsmodels.tsa.stattools import adfuller

# 示例時間序列數據
data = pd.Series([your_time_series_data])

# 執行ADF檢定
result = adfuller(data)

# 提取並顯示結果
adf_statistic = result[0]
p_value = result[1]
used_lag = result[2]
n_obs = result[3]
critical_values = result[4]

print(f'ADF Statistic: {adf_statistic}')
print(f'p-value: {p_value}')
print(f'Used Lag: {used_lag}')
print(f'Number of Observations: {n_obs}')
print('Critical Values:')
for key, value in critical_values.items():
    print(f'   {key}: {value}')

解讀結果

  • ADF 統計量:一個負值,其中更負的值表示對零假設的證據更強。
  • p 值: 若 p 值低於顯著性水平(例如,0.05),則您拒絕零假設,認定時間序列為站性。
  • 臨界值:這些值幫助確定不同信任等級(1%,5%,10%)的閾值,用來與 ADF 統計量進行比較。

範例和結論

考慮一個金融時間序列數據,像是每日股價。應用 ADF 檢定可能會得出 p 值大於0.05,表明非站性。在此情況下,可能需要進行數據轉換建如差分或去趨勢以達到站性,然後再應用進一步的統計模型。

總結來說,ADF 檢定是檢測時間序列站性的重要工具。通過了解並應用此檢定,分析師能更好地為建模做好數據準備,從而確保他們結果的有效性和可靠性。