Why It Is So Hard to Sell Core Banking Systems
Convincing a bank to replace its core banking system should be easy in theory. After all, the promise is huge: a safer, more reliable, and compliant engine that could save banks and their customers millions. Yet, in practice, it is one of the hardest sales in technology. The reasons go far beyond technology—they lie deep within the human, political, and regulatory fabric of the banking industry.
At the heart of the challenge are the people running the banks. Broadly speaking, there are two types. The first are stewards—or what I call “babysitters.” These bankers are conservative, risk-averse, and focused on not rocking the boat. They’re not sabotaging the bank’s future, but they aren’t championing innovation either. Their mindset is survival, not transformation. The second type are mavericks—rare individuals who look beyond their own tenure. They want to future-proof the bank, save customers money, and avoid being the “Kodak” or “Blockbuster” of finance. They embrace technology as the only way to adapt to a rapidly changing world. Unfortunately, the majority of decision-makers lean toward the steward side, while true mavericks are few and far between.
Replacing a core banking system is never a decision made by one person. Banks are regulated entities with complex governance structures, and every move requires the blessing—or at least the “non-objection”—of multiple stakeholders. Statutory board members are ultimately the only people who can sign off, but they face personal liability, which makes them cautious. CEOs may be the public face of the bank but are rarely the driving force. CFOs scrutinize the business case, sometimes comparing apples to oranges. COOs, responsible for both operations and IT, are often the most critical allies. Risk and compliance officers demand assurance that the new system meets regulations and often view change as more dangerous than sticking with the old. Security teams believe their standards are the best in the industry and impose their own requirements, while legal and procurement pore over contracts and policies, often dragging the process out. Ironically, the IT and operations staff who must actually use the new system often resist the most, fearing job loss or exposure of past failures.
Beyond the bank itself, external stakeholders shape the process as well. Regulators, auditors, consultants, and even investors all influence decision-making. Each has its own agenda, and alignment is rare. Regulators add yet another layer of complexity. Prudential authorities assess outsourcing risk, conduct regulators scrutinize consumer protections, privacy authorities demand adherence to strict data laws, and fiscal authorities determine tax implications that can reshape the business case. At best, regulators don’t object; rarely do they explicitly endorse. This culture of caution trickles down into every decision.
Selling a core banking system isn’t only about logic and cost savings—it’s about emotions and politics. Employees worry about their jobs. Executives worry about their reputations. Consultants may profit from legacy system failures and thus resist change. Sometimes resistance is downright irrational. One operations head once disliked automation because it replaced eighty people with eight. These personal and political dynamics often outweigh even the most compelling financial case.
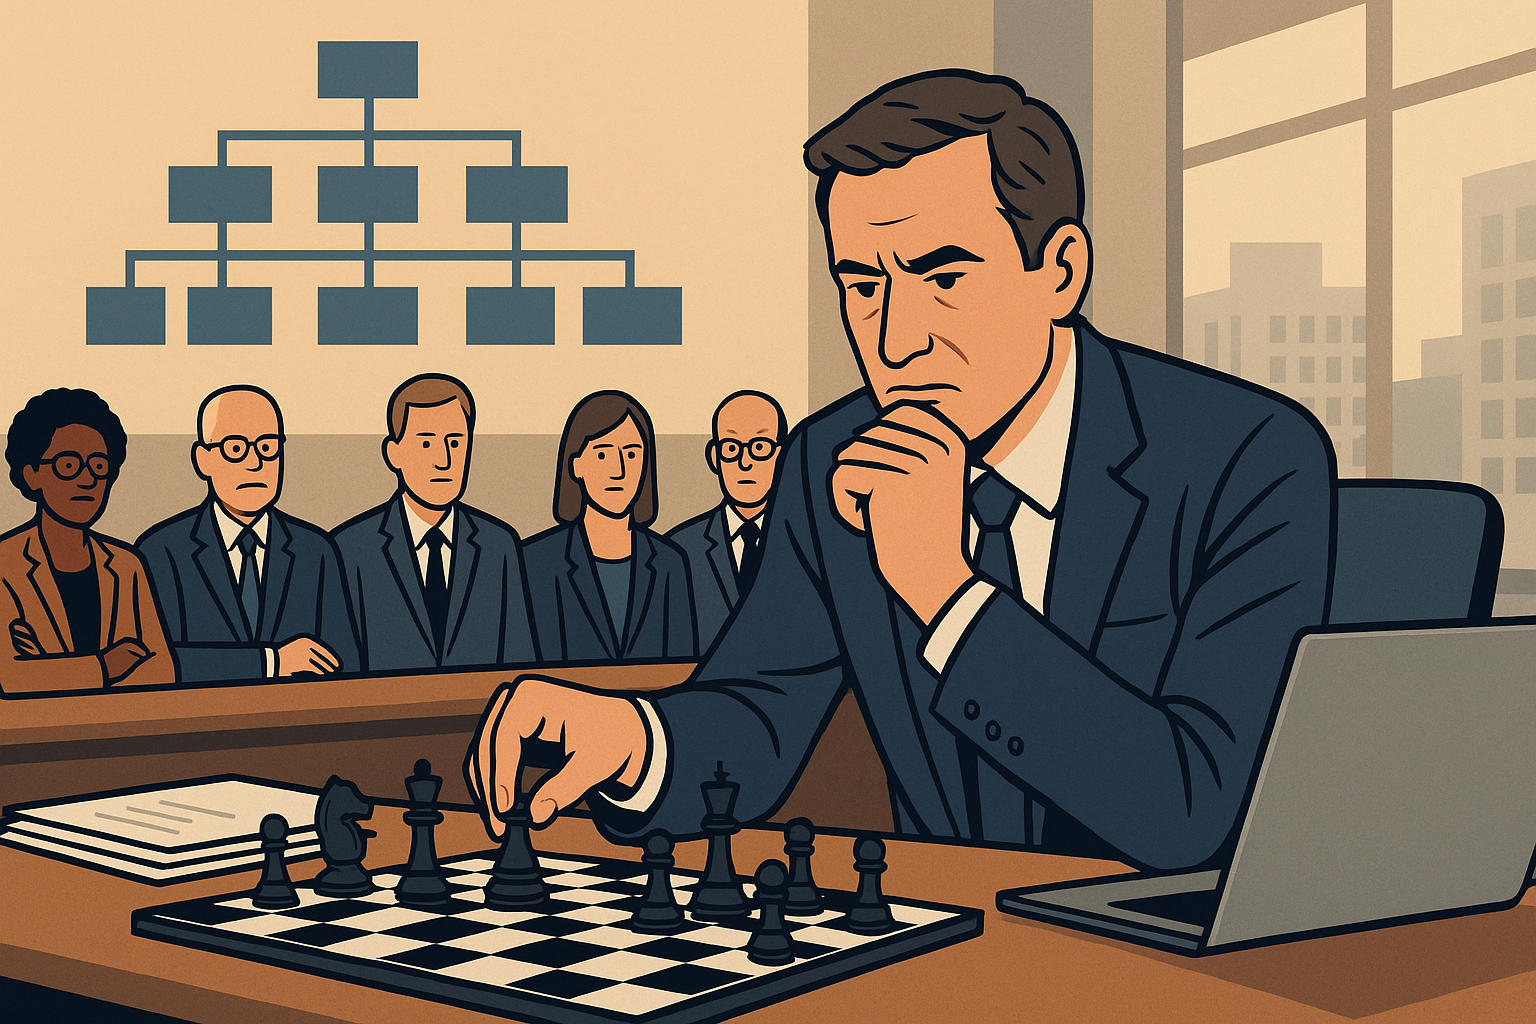
For those selling core banking systems, the process feels less like sales and more like a long game of chess. Each stakeholder is a piece with unique powers, blind spots, and motivations. Winning requires patience, strategy, and the ability to anticipate moves many steps ahead. Brute force doesn’t work. Nor does a single champion. Deals are closed only when every piece is aligned—legal, regulatory, political, operational, and emotional.
The great irony is that the very systems banks cling to—patched, outdated, and inefficient—are the greatest risks to their survival. But change only happens when the right stakeholders see beyond the short-term and choose to embrace the future. Until more mavericks rise into leadership positions, the default stance of most banks will remain caution, not transformation.