Why We Get Stuck in Self-Criticism
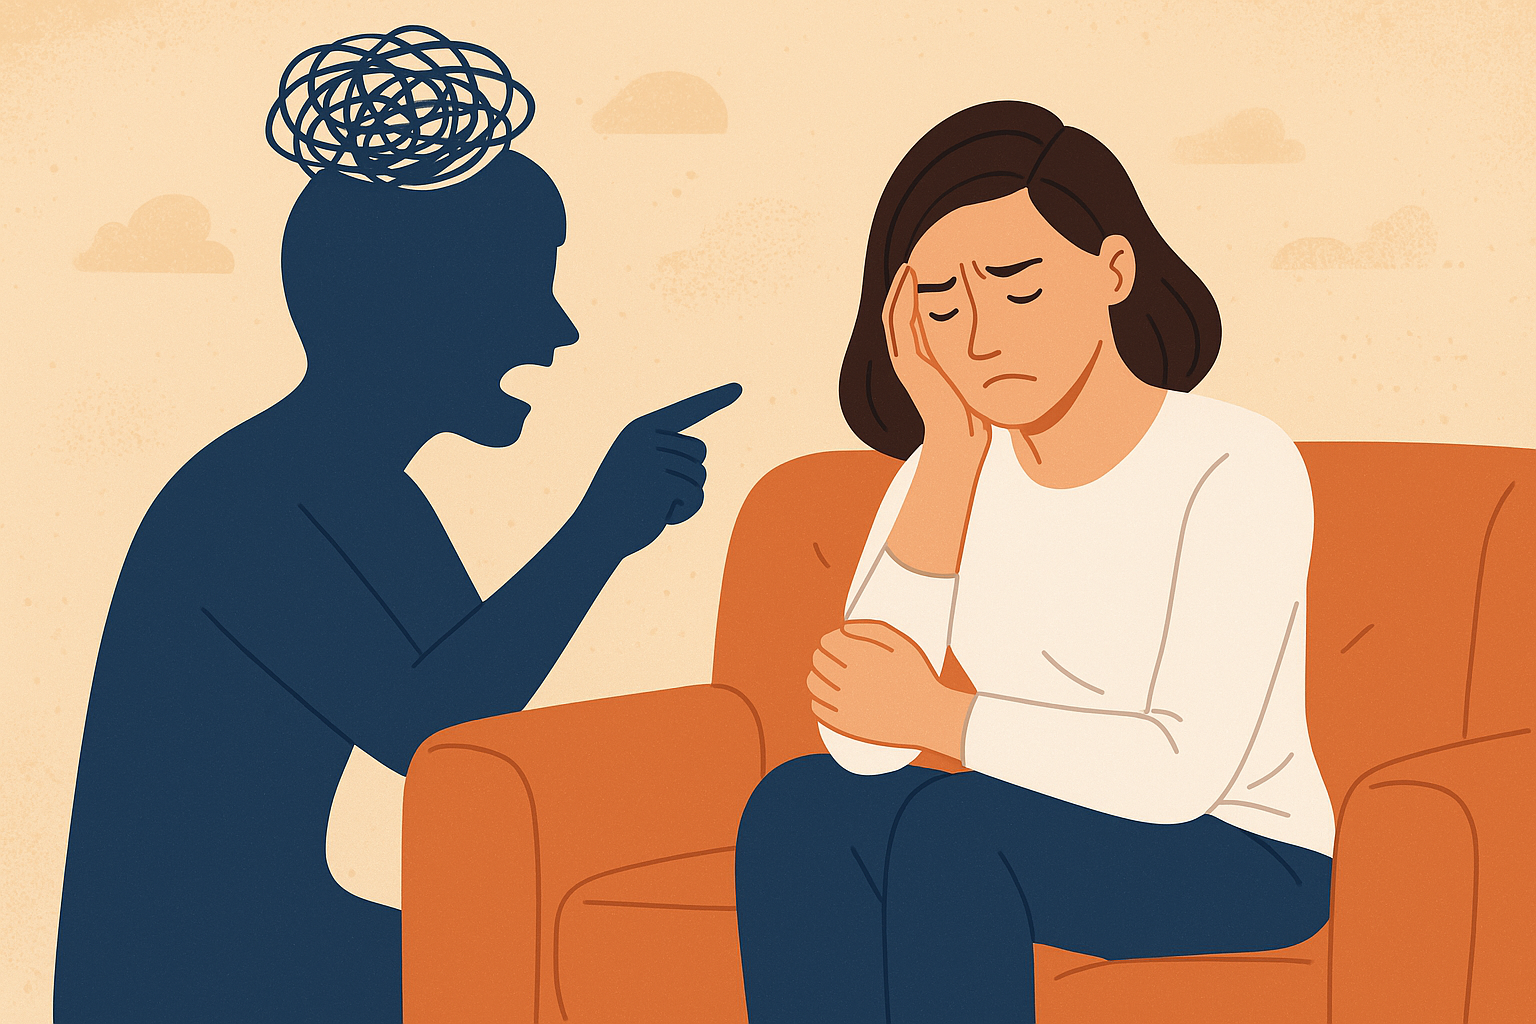
We’ve all experienced it: that inner voice that won’t let up, the one that criticizes, doubts, and questions our every move. Sometimes it whispers, sometimes it shouts, but its message is always the same: you’re not enough. Ironically, even though research shows that self-criticism fuels stress, anxiety, and depression, many of us keep falling back into it as if it were helping us. The truth is, self-criticism is not a weakness. It is a survival mechanism that our brain and culture have trained us to adopt. But here’s the good news: what’s learned can also be unlearned.
Our brains evolved to keep us safe. They cling to negative experiences like Velcro, while letting positive ones slip away like Teflon. This negativity bias once helped us survive in dangerous environments, but today it means we’re more likely to replay an embarrassing comment at work than to savor a compliment from a friend. We turn this instinct inward, mistaking self-criticism for protection. We convince ourselves that if we point out our flaws first, others won’t have the chance to hurt us. Yet what really happens is that we exhaust ourselves with anxiety, shame, and self-doubt.
On top of that, society loves comparisons. From grades in school to performance reviews at work, from beauty standards in magazines to the perfect lives on social media, we are constantly told we don’t measure up. Slowly, these external voices become internal ones. We inherit cultural habits of self-deprecation, and for some, the scars of criticism or neglect in childhood deepen the pattern. Over time, self-criticism becomes second nature, an automatic reflex that feels impossible to resist.
But let’s pause here. Just because self-criticism has roots in our survival doesn’t mean it’s the best path forward. In fact, the idea that self-criticism motivates us is one of the biggest myths we tell ourselves. Think about it: when was the last time you felt creative, energized, and fully alive because you scolded yourself? Real motivation doesn’t come from a harsh inner critic. It comes from encouragement. Studies show that people who practice self-compassion are not only happier, but they are also seen as more capable, responsible, and resilient by others.
Imagine treating yourself the way a great coach treats their team. Golden State Warriors coach Steve Kerr doesn’t spend halftime tearing down his players. Instead, he highlights what they’ve done well and inspires them to do more of it. The result? His team comes back stronger, more confident, and ready to win. If positive reinforcement can transform professional athletes under pressure, imagine what it could do for your own life.
Of course, not all criticism is harmful. Constructive self-reflection has its place. The difference is in tone and focus. Healthy self-talk addresses behaviors you can change—“I should manage my budget better this month”—without attacking your worth—“I’m terrible with money.” The first empowers. The second destroys.
Breaking free from self-criticism is not about silencing your inner voice. It’s about retraining it. Like any habit, it takes practice. At first, being kind to yourself will feel unnatural, maybe even lazy. But stick with it. Over time, encouragement becomes the new reflex. The inner critic fades, and a supportive inner coach takes its place. That’s when you’ll notice not only a lighter heart, but also greater strength, resilience, and joy in everything you do.
So the next time that harsh voice tries to drag you down, remind yourself: self-criticism doesn’t make you stronger, it makes you smaller. Compassion, encouragement, and love are what fuel real growth. You already carry within you the ability to be your own best coach, your own most reliable ally. All it takes is the courage to start listening.
You are not your mistakes, and you are not defined by self-criticism. Be the voice that lifts you higher, not the one that drags you down. Choose encouragement over judgment, and watch yourself rise.