Quote Snapshot
- Last Price: 0.142 HKD
- Day Change: +0.003 (+2.11%)
- Open: HKD
- High: HKD
- Low: HKD
- Previous Close: 0.142 HKD
- Volume:
- Market Cap: 113.53 M
- P/E Ratio:
- Dividend Yield: %
- Board Lot: 2,000
- ISIN: BMG987731079
- Industry: Properties & Construction - Properties
Risk & Return Metrics
Based on 490 trading days of close price data (daily returns, annualized using 252 trading days).
| Metric | Daily | Annualized |
|---|---|---|
| Expected Return | -0.0307% | -7.44% |
| Risk (Std Dev) | 5.6401% | 89.53% |
| Metric | Value |
|---|---|
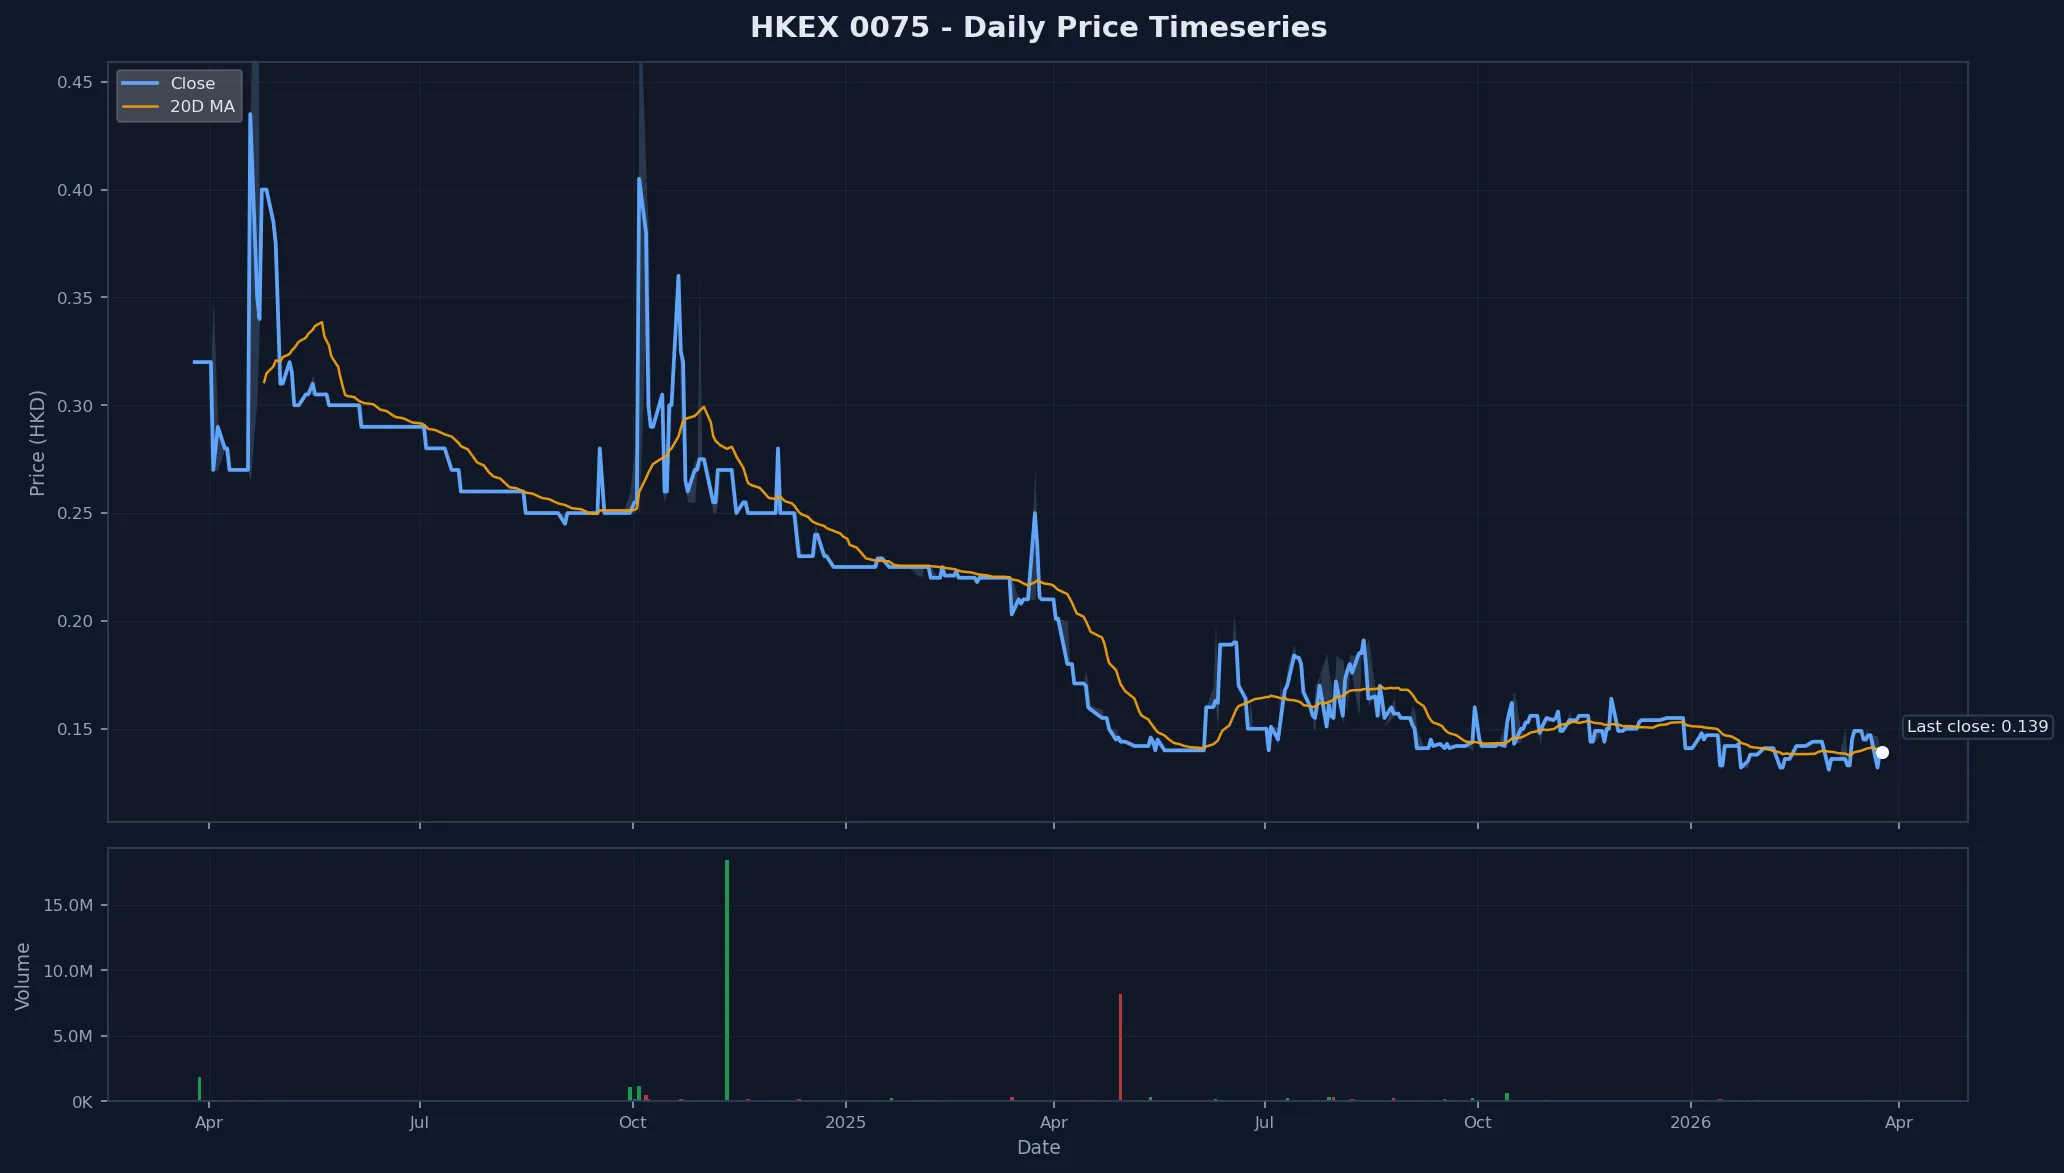
| First Price (HKD) | 0.320 |
| Last Price (HKD) | 0.139 |
| Total Return | -56.56% |
hkex stock equity 75