Apple Inc. (AAPL) is one of the world’s most traded equities. This analysis applies the Cup & Handle pattern detection algorithm to AAPL’s 5-year closing price series to identify potential breakout opportunities.
What is a Cup & Handle Pattern?
The Cup & Handle is a bullish continuation pattern first described by William O’Neil in How to Make Money in Stocks (1988). It consists of:
- Cup — A rounded U-shaped price decline and recovery, resembling the profile of a teacup
- Handle — A short consolidation or minor pullback after the right rim of the cup
- Breakout — Price breaks above the right rim, with a price target equal to the cup’s depth added to the breakout point
The pattern signals that sellers have been absorbed and buyers are regaining control.
Detection Methodology
The algorithm scans the price series using the following criteria:
| Parameter | Value |
|---|---|
| Cup width | 15 – 300 trading days |
| Cup depth | 5% – 60% of left rim price |
| Rim symmetry | Right rim within ±12% of left rim |
| Handle length | 3 – 50 trading days |
| Handle depth | < 65% of cup depth |
| Handle floor | Must stay above mid-cup level |
Breakout target formula:
Breakout Price = Right Rim + Cup Depth
Cup Depth = Left Rim Price − Cup Bottom Price
Detected Patterns (5-Year Period)
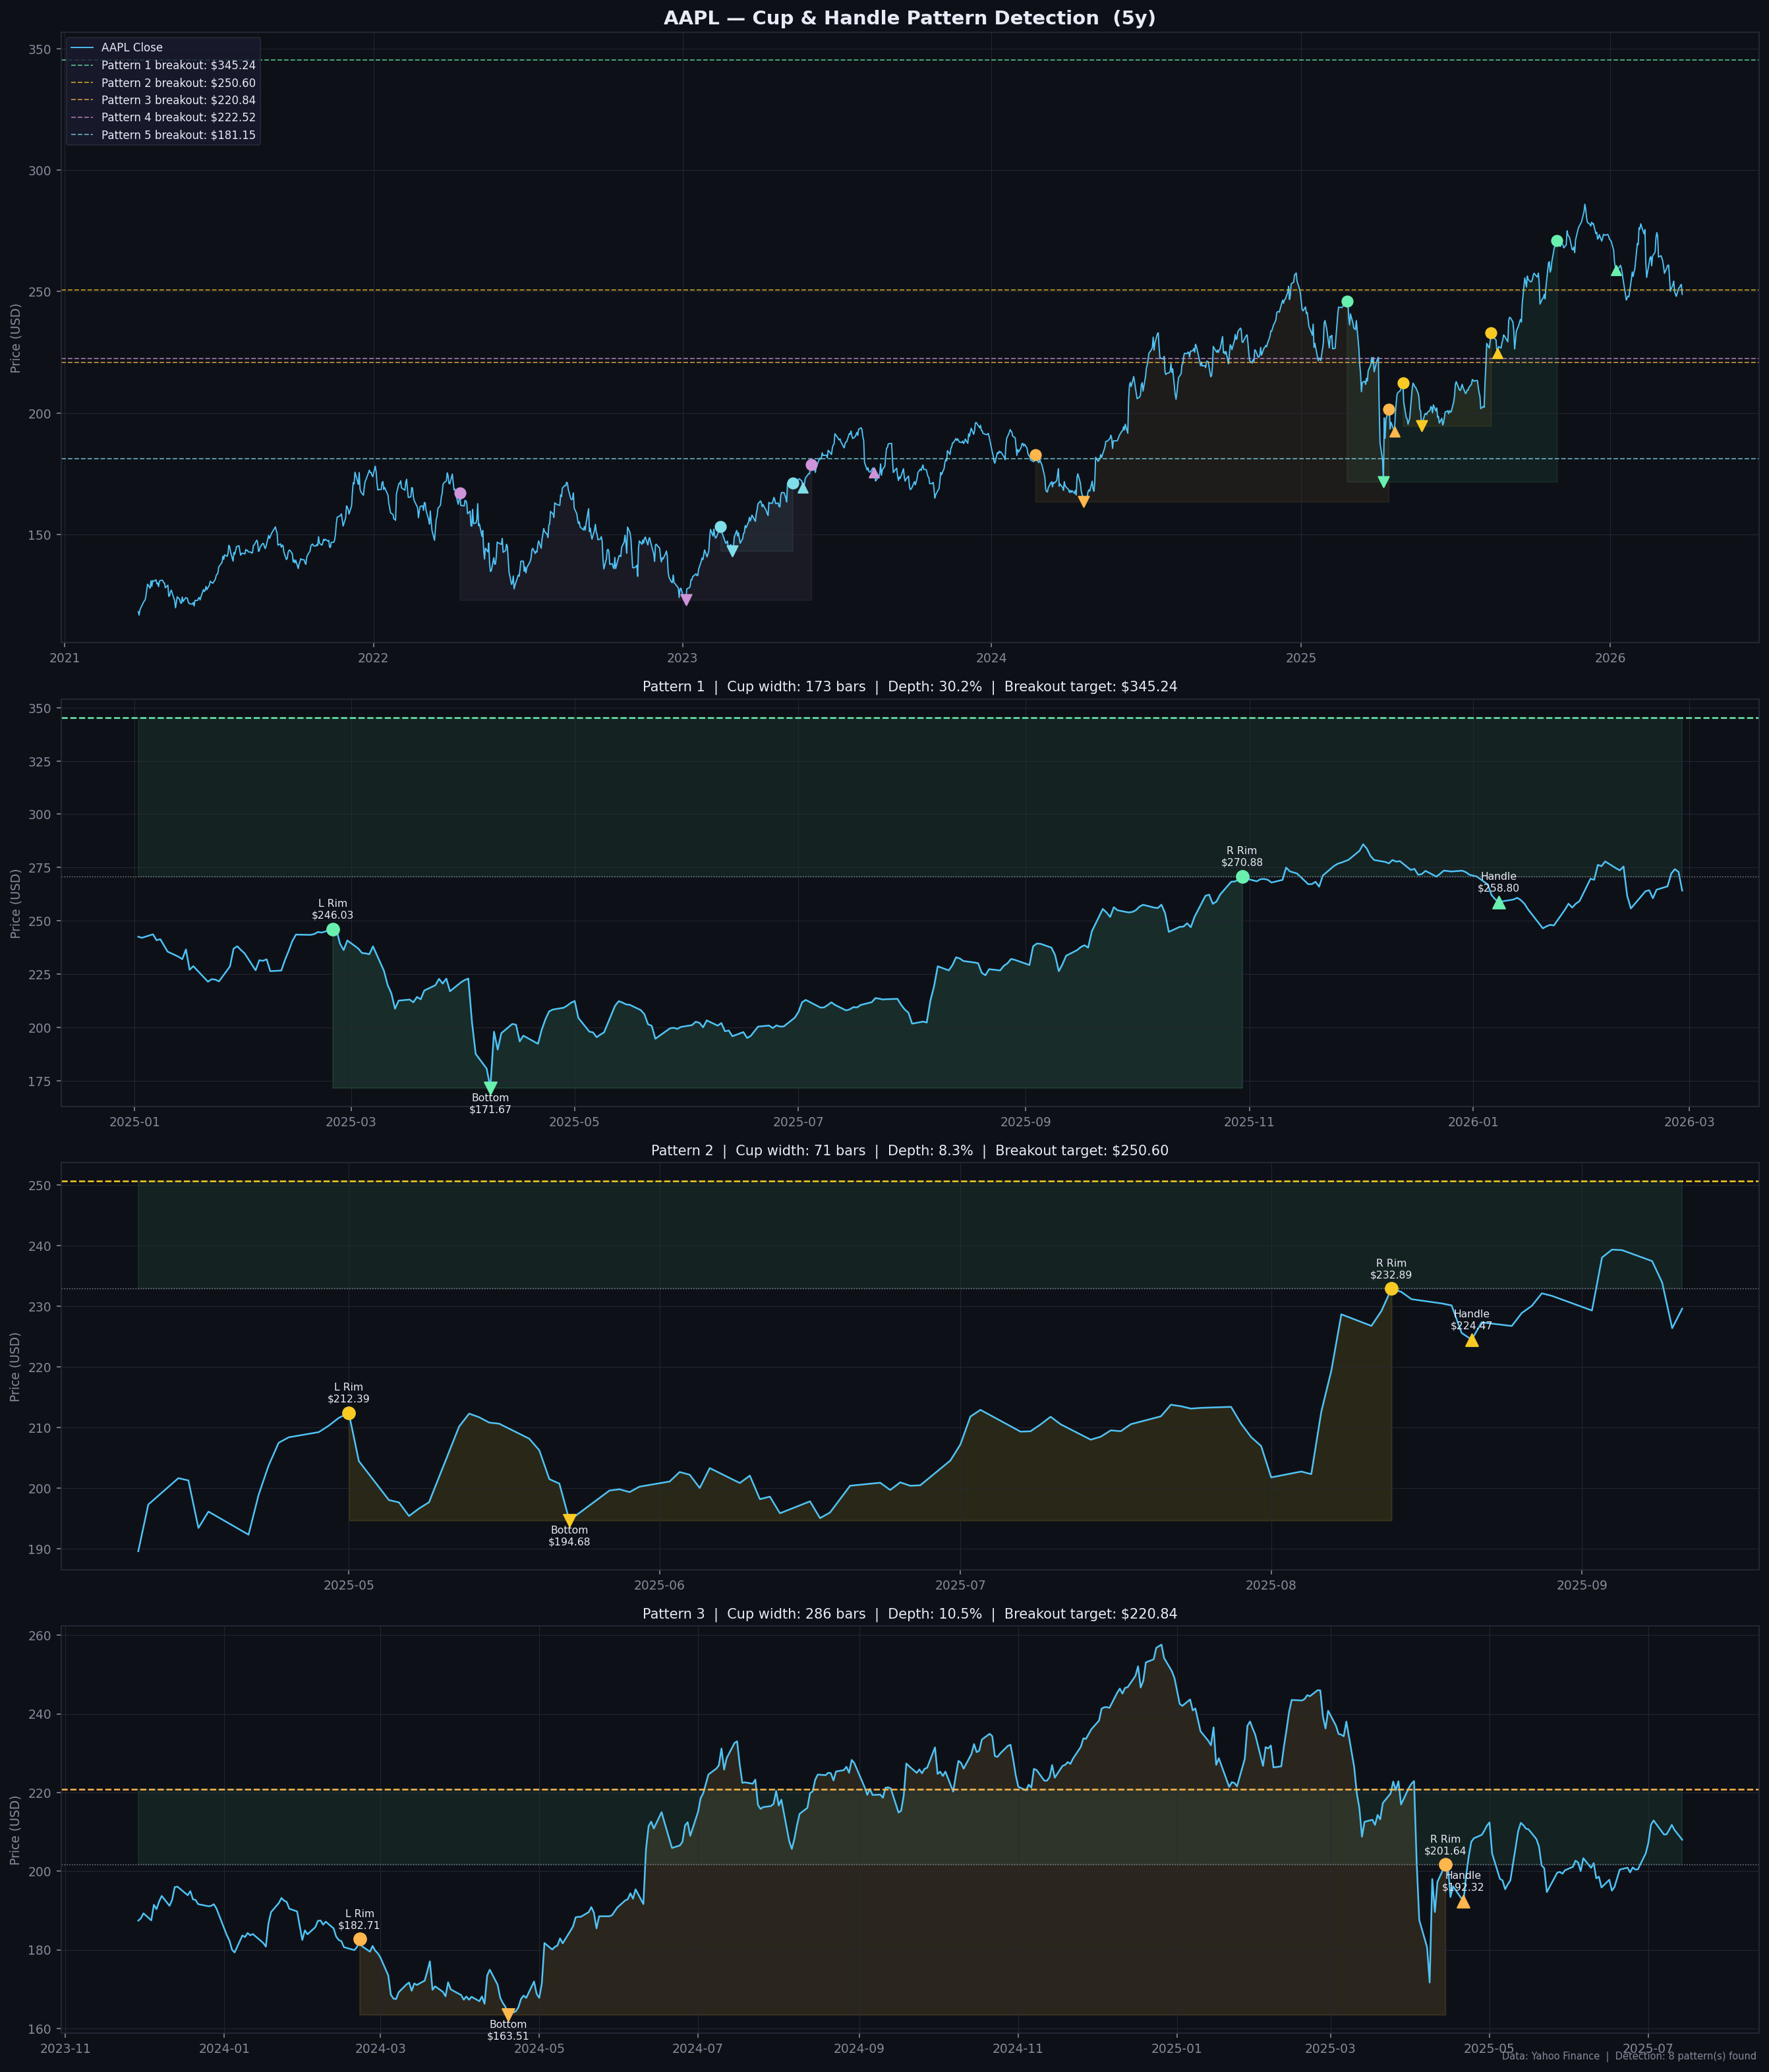
8 cup & handle formations were identified in AAPL’s price history. The 3 most recent and significant:
Pattern 1 — Strongest Signal ✅
| Level | Price (USD) |
|---|---|
| Left Rim | $246.03 |
| Cup Bottom | $171.67 |
| Right Rim | $270.88 |
| Handle Low | $258.80 |
| Breakout Target | $345.24 |
- Cup depth: 30.2% — a significant decline coinciding with the January–February 2025 AI sector rotation and the DeepSeek-driven selloff
- Cup width: 173 trading days (~8 months)
- Upside potential: ~28% from the right rim
- The handle formed tightly between $258–$271, indicating strong consolidation before a potential breakout
Pattern 2 — Near-Term Setup
| Level | Price (USD) |
|---|---|
| Left Rim | $212.39 |
| Cup Bottom | $194.68 |
| Right Rim | $232.89 |
| Handle Low | $224.47 |
| Breakout Target | $250.60 |
- Cup depth: 8.3% — a shallow, tight cup
- A shallower cup with a well-formed handle suggests a lower-risk entry
Pattern 3 — Large Multi-Month Cup (2023–2025)
| Level | Price (USD) |
|---|---|
| Left Rim | $182.71 |
| Cup Bottom | $163.51 |
| Right Rim | $201.64 |
| Handle Low | $192.32 |
| Breakout Target | $220.84 |
- Cup width: 286 trading days (~14 months)
- This target of $220.84 was already achieved and exceeded — confirming the pattern’s validity on historical data ✅
Log Return & Risk Metrics (10-Year)
| Metric | Daily | Annualized |
|---|---|---|
| Expected Return | 0.0938% | 23.63% |
| Risk (Std Dev) | 1.7069% | 27.10% |
| Sharpe Ratio (rf=5%) | — | 0.69 |
Interpretation & Caveats
- Cup & Handle is a lagging pattern — it confirms after the structure has formed, not in real-time
- Pattern 1’s $345 target is ambitious; it assumes the same momentum as the cup depth, which may be impacted by broader macro conditions (tariffs, AI capex cycle)
- Volume confirmation is important — a breakout on high volume is significantly more reliable than a low-volume breakout
- This analysis is for educational purposes only and does not constitute financial advice
References
- O’Neil, W. (1988). How to Make Money in Stocks. McGraw-Hill.
- Bulkowski, T. (2005). Encyclopedia of Chart Patterns. Wiley.
- Data sourced from Yahoo Finance via
yfinance
aapl apple cup-and-handle technical-analysis stock equity