
Intel Corporation (INTC) is a global leader in semiconductor design and manufacturing, headquartered in Santa Clara, California. The company designs and produces processors, chipsets, and related technologies for computing and communications industries worldwide.
Quote Snapshot
- Last Price: $120.35 USD
- Day Change: -6.67 (-5.25%)
- 52-Week High: $142.35
- 52-Week Low: $18.97
- Market Cap: $604.88B
- Enterprise Value: $630.72B
- Volume: 125,021,717
- Avg Volume: 136,578,862
- Sector: Technology
- Industry: Semiconductors
Valuation Measures
| Metric |
Value |
| P/E (Trailing) |
N/A |
| P/E (Forward) |
77.06 |
| PEG Ratio |
1.36 |
| Price/Book |
5.43 |
| Price/Sales (TTM) |
11.25 |
| EV/Revenue |
11.73 |
| EV/EBITDA |
44.50 |
Financial Highlights
| Metric |
Value |
| Revenue (TTM) |
$53.76B |
| Revenue Growth |
7.20% |
| Gross Margins |
37.20% |
| Operating Margins |
6.88% |
| Profit Margins |
-5.90% |
| EBITDA |
$14.17B |
| Free Cash Flow |
$-8.30B |
| Return on Equity |
-2.91% |
| Return on Assets |
0.63% |
| Debt/Equity |
36.03 |
Dividends
| Metric |
Value |
| Dividend Rate |
N/A |
| Dividend Yield |
N/A |
| Payout Ratio |
0.00% |
Technical Indicators
| Metric |
Value |
| Beta |
2.19 |
| 50-Day Average |
$113.38 |
| 200-Day Average |
$60.33 |
Analyst Ratings
- Consensus: HOLD
- Number of Analysts: 42
- Price Target (Mean): $100.88
- Price Target (Low): $45.00
- Price Target (High): $200.00
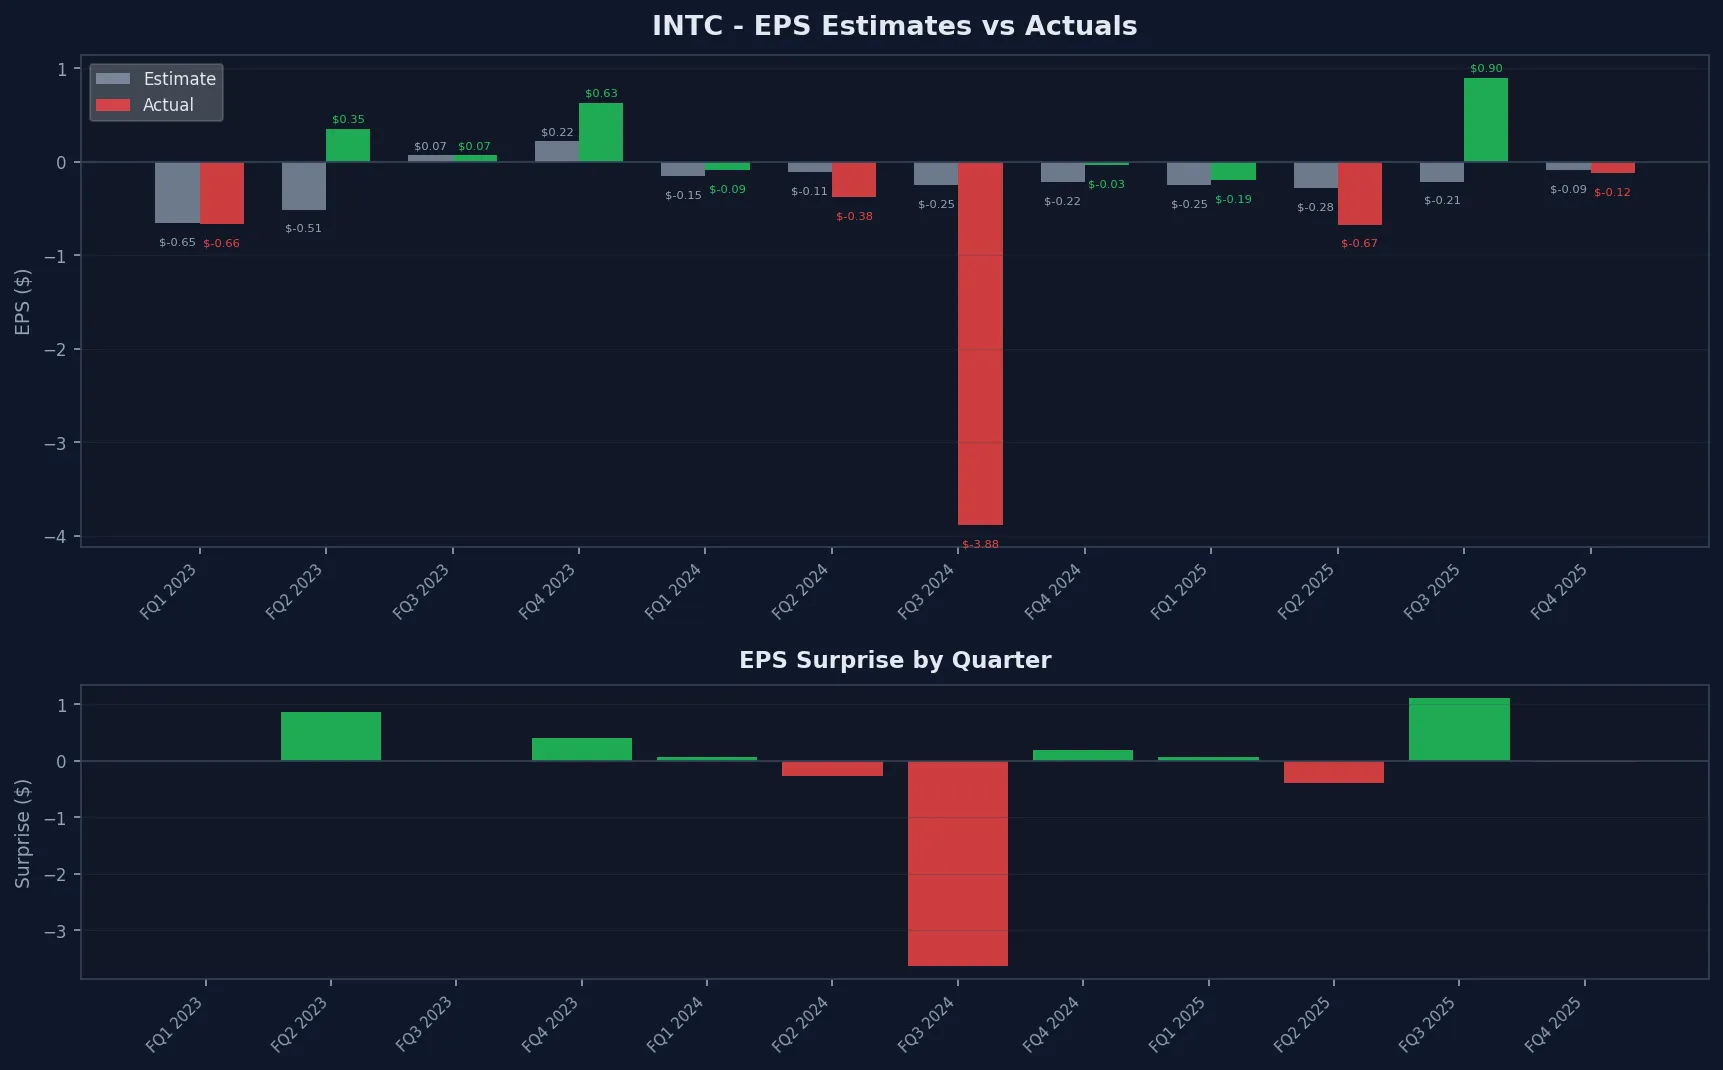
Annual EPS Estimates
| Metric |
avg |
low |
high |
yearAgoEps |
numberOfAnalysts |
growth |
currency |
| 0q |
0.21 |
0.20 |
0.33 |
-0.10 |
33 |
3.11 |
USD |
| +1q |
0.27 |
0.22 |
0.37 |
0.23 |
33 |
0.16 |
USD |
| 0y |
1.09 |
0.95 |
1.39 |
0.42 |
40 |
1.61 |
USD |
| +1y |
1.56 |
0.94 |
2.42 |
1.09 |
39 |
0.43 |
USD |
Annual Revenue Estimates
| Metric |
avg |
low |
high |
numberOfAnalysts |
yearAgoRevenue |
growth |
currency |
| 0q |
$14.40B |
$14.21B |
$14.86B |
34.00 |
$12.86B |
0.12 |
USD |
| +1q |
$15.05B |
$14.15B |
$15.67B |
34.00 |
$13.65B |
0.10 |
USD |
| 0y |
$58.73B |
$56.77B |
$64.71B |
41.00 |
$52.85B |
0.11 |
USD |
| +1y |
$65.60B |
$56.19B |
$78.90B |
41.00 |
$58.73B |
0.12 |
USD |
Risk & Return Metrics
Based on 501 trading days of close price data (daily returns, annualized using 252 trading days).
| Metric |
Daily |
Annualized |
| Expected Return |
0.3700% |
153.64% |
| Risk (Std Dev) |
4.4682% |
70.93% |
| Metric |
Value |
| First Price (USD) |
$31.03 |
| Last Price (USD) |
$120.35 |
| Total Return |
287.81% |