 The trend for NVDA is predicted to go up tomorrow.
Headlines
The latest headline about NVIDIA Corporation (NVDA) is that the French competition authority has confirmed an investigation into NVIDIA. This investigation comes as NVIDIA continues to navigate competitive pressures and maintain its market position in the AI and semiconductor industries.
Sentiment analysis
The impact of the investigation by the French competition authority on NVIDIA’s stock price is uncertain and could depend on the investigation’s findings and market perception.
Key Metrics & Risk
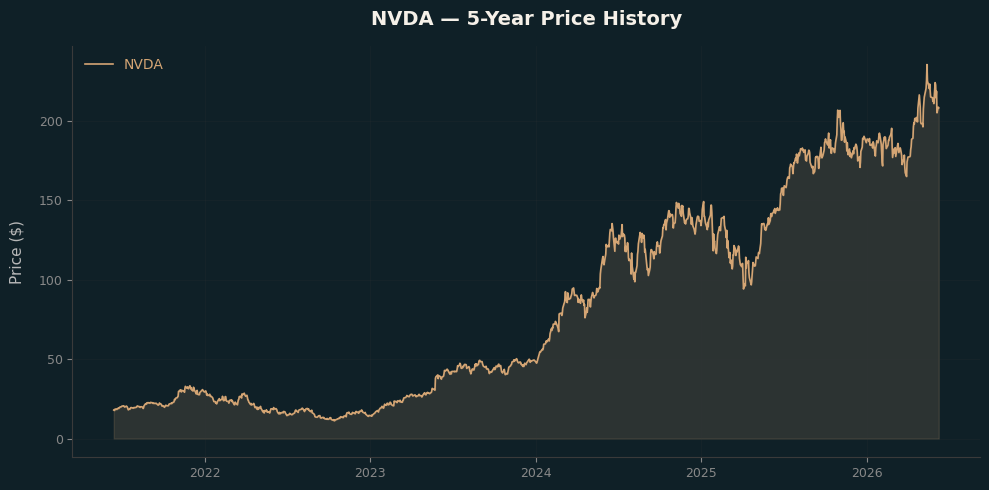
Based on 1256 trading days of close price data (daily returns, annualized using 252 trading days).
| Metric | Value |
|---|---|
| Latest Price | $205.10 |
| Day Change | $-13.56 (-6.20%) |
| 52-Week High | $214.87 |
| 52-Week Low | $204.33 |
| Volume | 218,529,000 |
| Metric | Daily | Annualized |
|---|---|---|
| Expected Return | 0.2486% | 86.95% |
| Risk (Std Dev) | 3.2600% | 51.75% |
| Total Return (period) | 1068.38% | | First Price | $17.55 | | Period | 1256 days (start to 2026-06-05) |
Fundamentals
| Metric | Value |
|---|---|
| Market Cap | 4854.37B |
| Enterprise Value | 4809.81B |
| Trailing P/E | 30.69 |
| Forward P/E | 15.75 |
| Price to Book | 24.84 |
| Price to Sales | 19.15 |
| EV/Revenue | 18.97 |
| EV/EBITDA | 29.06 |
| Profitability | | | Profit Margin | 62.97% | | Operating Margin | 65.6% | | ROE | 114.29% | | ROA | 52.73% |
| Growth | | | Revenue Growth | 85.2% | | Earnings Growth | 214.5% |
| Dividend | | | Dividend Yield | 50.0% | | Payout Ratio | 0.61% | | 5Y Avg Yield | 5.0% |
| Financial Health | | | Total Revenue | 253.49B | | Total Debt | 12.81B | | Total Cash | 53.17B | | Free Cash Flow | 46.34B | | Operating Cash Flow | 125.65B |
| Price & Technical | | | 52W High | $236.54$ | | 52W Low | $140.85$ | | 50-Day Avg | $205.01$ | | 200-Day Avg | $188.91$ | | Beta | 2.2 | | Shares Outstanding | 24.22B | | Float Shares | 23.23B | | Insider Holdings | 3.98% | | Institutional Holdings | 70.86% | | Short Ratio | 1.71 | | Short % of Float | 1.22% |
| Analyst Targets | | | Target High | $500.0$ | | Target Low | $180.0$ | | Target Mean | $298.42$ | | Target Median | $288.0$ | | # of Analysts | 59 | | Recommendation | strong_buy |