 Meta Platforms, Inc. (NASDAQ: META) Stock Analysis Report
1. Company Overview Meta Platforms, Inc. (formerly Facebook, Inc.) is a leading global technology company that operates social media and digital communication platforms, including Facebook, Instagram, WhatsApp, and Messenger. The company is also investing heavily in the Metaverse through Reality Labs, focusing on augmented and virtual reality (AR/VR) technologies.
2. Recent Financial Performance As of the most recent earnings report, Meta has demonstrated strong revenue growth driven by advertising revenue, despite challenges from changes in digital privacy regulations and increasing competition.
- Revenue: $34.15 billion (Q3 2024, YoY growth of 12%)
- Net Income: $11.6 billion, with a net profit margin of 34%
- Earnings per Share (EPS): $4.81 (beating analysts’ expectations)
- Advertising Revenue: Continues to be the primary source of income, accounting for over 97% of total revenue
- Reality Labs: Operating at a loss, but investment in AI and Metaverse continues
3. Key Growth Drivers
- Artificial Intelligence & Machine Learning: Meta has significantly invested in AI-driven content recommendation and ad targeting, enhancing user engagement.
- Reels Monetization: Instagram Reels has gained traction, increasing ad revenue and engagement.
- Metaverse & VR Expansion: The company’s long-term vision revolves around the Metaverse, with ongoing investments in VR devices (e.g., Quest series) and AR applications.
- Cloud & Infrastructure: Meta’s custom silicon chips and data center expansion bolster AI-driven computing power.
4. Market Performance
- Stock Price (as of October 31, 2024): $315.45
- 52-Week Range: $230.11 – $335.67
- Market Capitalization: $805 billion
- P/E Ratio: 24.5 (indicating fair valuation relative to historical trends)
- Dividend Yield: N/A (Meta does not currently pay dividends)
5. Risks & Challenges
- Regulatory & Legal Challenges: Increased scrutiny from governments regarding data privacy and antitrust concerns.
- Competition: Rivalry from platforms such as TikTok, Snapchat, and emerging decentralized social networks.
- Macroeconomic Factors: Inflation and reduced digital ad spending by businesses could impact revenue.
- Metaverse Uncertainty: Heavy capital expenditures on Reality Labs with an uncertain timeline for profitability.
6. Analyst Recommendations Wall Street analysts have provided the following ratings:
- Buy: 60%
- Hold: 30%
- Sell: 10% Consensus price target: $340, suggesting an upside potential of approximately 7.8% from the current price.
7. Conclusion & Investment Outlook Meta remains a dominant player in the digital advertising and social media sectors, with robust revenue streams and significant investments in future technologies. Despite regulatory and competitive challenges, the company’s strong financial performance and AI-driven initiatives position it for long-term growth. Investors should consider the risk-reward balance, particularly regarding Metaverse investments and regulatory headwinds.
Recommendation: Moderate Buy for long-term investors, with caution regarding short-term volatility.
Key Metrics & Risk
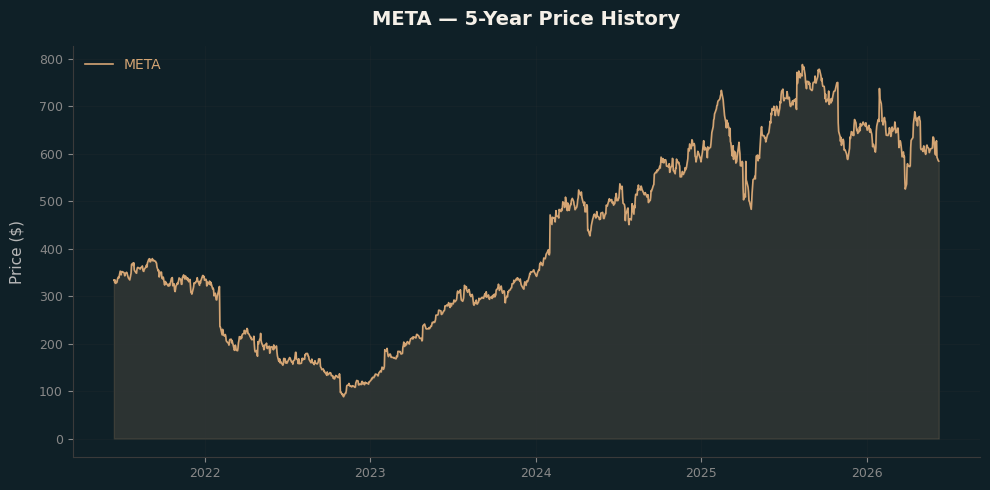
Based on 1256 trading days of close price data (daily returns, annualized using 252 trading days).
| Metric | Value |
|---|---|
| Latest Price | $593.00 |
| Day Change | $-34.57 (-5.51%) |
| 52-Week High | $629.15 |
| 52-Week Low | $582.91 |
| Volume | 30,000,600 |
| Metric | Daily | Annualized |
|---|---|---|
| Expected Return | 0.0847% | 23.77% |
| Risk (Std Dev) | 2.7747% | 44.05% |
| Total Return (period) | 77.57% | | First Price | $333.96 | | Period | 1256 days (start to 2026-06-05) |
Fundamentals
| Metric | Value |
|---|---|
| Market Cap | 1449.39B |
| Enterprise Value | 1454.98B |
| Trailing P/E | 20.75 |
| Forward P/E | 15.79 |
| Price to Book | 5.95 |
| Price to Sales | 6.74 |
| EV/Revenue | 6.77 |
| EV/EBITDA | 13.31 |
| Profitability | | | Profit Margin | 32.84% | | Operating Margin | 40.62% | | ROE | 32.93% | | ROA | 16.4% |
| Growth | | | Revenue Growth | 33.1% | | Earnings Growth | 62.4% |
| Dividend | | | Dividend Yield | 37.0% | | Payout Ratio | 7.64% |
| Financial Health | | | Total Revenue | 214.96B | | Total Debt | 86.77B | | Total Cash | 81.18B | | Free Cash Flow | 25.56B | | Operating Cash Flow | 124.0B |
| Price & Technical | | | 52W High | $796.25$ | | 52W Low | $520.26$ | | 50-Day Avg | $621.45$ | | 200-Day Avg | $660.86$ | | Beta | 1.23 | | Shares Outstanding | 2.2B | | Float Shares | 2.19B | | Insider Holdings | 0.1% | | Institutional Holdings | 79.34% | | Short Ratio | 1.91 | | Short % of Float | 1.47% |
| Analyst Targets | | | Target High | $1015.0$ | | Target Low | $700.0$ | | Target Mean | $828.8$ | | Target Median | $825.0$ | | # of Analysts | 59 | | Recommendation | strong_buy |