 Intuitive Surgical, Inc. (ISRG) is a leading company in the field of robotic-assisted minimally invasive surgery. The company’s flagship product, the da Vinci Surgical System, has revolutionized surgical procedures by enhancing precision and reducing recovery times.
As of February 14, 2025, ISRG’s stock is trading at $591.39, reflecting a slight increase from the previous close. Over the past year, the stock has appreciated by approximately 55.59%, indicating strong market performance.
In the fiscal year 2024, Intuitive Surgical reported revenue of $8.35 billion, a 17.24% increase from the previous year, and a net income of $2.32 billion, marking a 29.18% rise. The company’s gross margin stands at 67.46%, with an operating margin of 28.38%.
Analysts maintain a favorable outlook on ISRG, with a consensus rating of “Strong Buy.” The average 12-month price target is $578.94, suggesting a potential slight decrease from the current price.
The company’s financial health is robust, evidenced by a current ratio of 4.07 and a minimal debt-to-equity ratio of 0.01. This strong liquidity position underscores Intuitive Surgical’s capacity to meet its short-term obligations and invest in future growth.
In summary, Intuitive Surgical continues to demonstrate strong financial performance and market leadership in robotic-assisted surgery. While the stock has experienced significant appreciation, the current valuation and analyst projections suggest a stable outlook.
Key Metrics & Risk
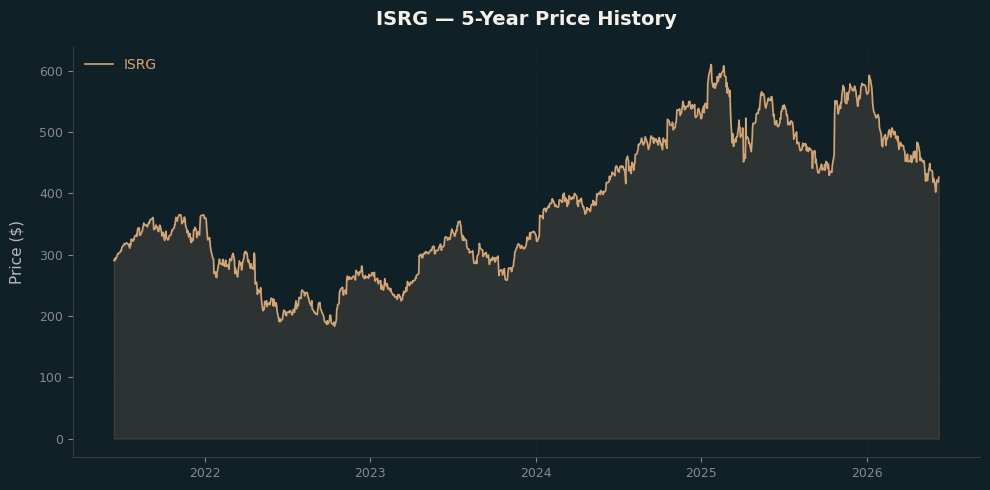
Based on 1256 trading days of close price data (daily returns, annualized using 252 trading days).
| Metric | Value |
|---|---|
| Latest Price | $422.06 |
| Day Change | $+3.24 (+0.77%) |
| 52-Week High | $428.46 |
| 52-Week Low | $419.50 |
| Volume | 2,774,000 |
| Metric | Daily | Annualized |
|---|---|---|
| Expected Return | 0.0553% | 14.94% |
| Risk (Std Dev) | 2.0895% | 33.17% |
| Total Return (period) | 52.35% | | First Price | $277.04 | | Period | 1256 days (start to 2026-06-05) |
Fundamentals
| Metric | Value |
|---|---|
| Market Cap | 145.92B |
| Enterprise Value | 141.53B |
| Trailing P/E | 50.0 |
| Forward P/E | 34.94 |
| Price to Book | 8.36 |
| Price to Sales | 13.79 |
| EV/Revenue | 13.37 |
| EV/EBITDA | 36.42 |
| Profitability | | | Profit Margin | 28.15% | | Operating Margin | 30.87% | | ROE | 17.23% | | ROA | 10.24% |
| Growth | | | Revenue Growth | 23.0% | | Earnings Growth | 18.8% |
| Financial Health | | | Total Revenue | 10.58B | | Total Debt | 0.0B | | Total Cash | 4.52B | | Free Cash Flow | 2.25B | | Operating Cash Flow | 3.36B |
| Price & Technical | | | 52W High | $603.88$ | | 52W Low | $396.68$ | | 50-Day Avg | $446.12$ | | 200-Day Avg | $492.83$ | | Beta | 1.45 | | Shares Outstanding | 0.35B | | Float Shares | 0.35B | | Insider Holdings | 0.55% | | Institutional Holdings | 89.25% | | Short Ratio | 3.18 | | Short % of Float | 2.06% |
| Analyst Targets | | | Target High | $750.0$ | | Target Low | $366.0$ | | Target Mean | $565.25$ | | Target Median | $574.0$ | | # of Analysts | 29 | | Recommendation | buy |