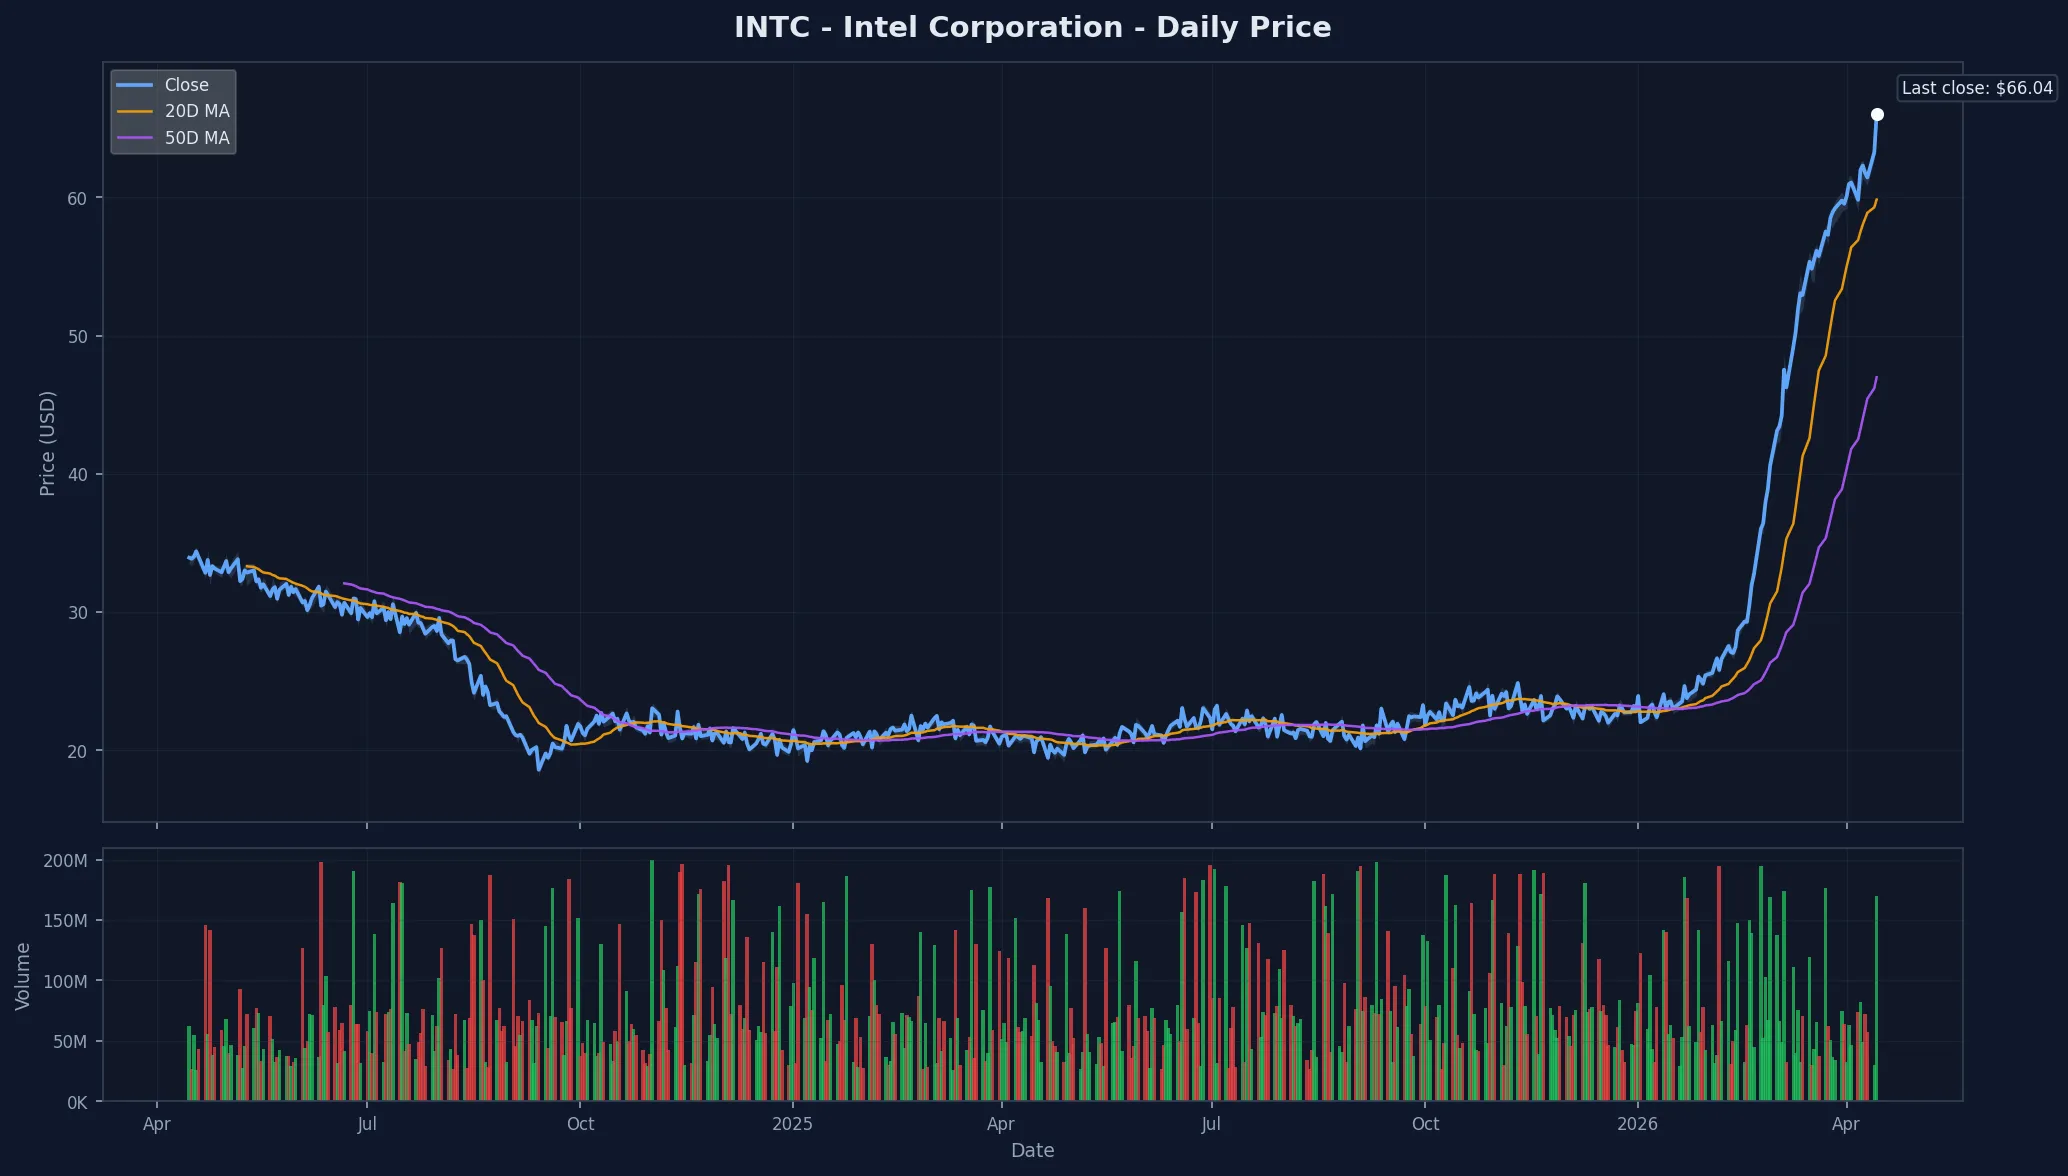
Intel Corporation (INTC) is a global leader in semiconductor design and manufacturing, headquartered in Santa Clara, California. Listed on the NASDAQ, Intel designs and produces processors, chipsets, and related technologies for computing and communications industries worldwide. As of April 14, 2026, the stock is trading at $65.18, up $2.80 (+4.49%) from the previous close.
Quote Snapshot
- Last Price: $65.18 USD
- Day Change: +2.80 (+4.49%)
- Post-Market: $65.78 (+0.60, +0.92%)
- 52-Week High: $65.78
- 52-Week Low: $18.51
- Market Cap: ~$280B
- Volume: 48.2M
- Exchange: NASDAQ
Wall St. Ratings
| Source | Rating | Score |
|---|
| SA Analysts | HOLD | 3.41 |
| Wall Street | HOLD | 3.16 |
| Quant | HOLD | 3.46 |
Analysts Breakdown (Last 90 Days)
48 Analysts
| Rating | Count |
|---|
| Strong Buy | 8 |
| Buy | 1 |
| Hold | 33 |
| Sell | 3 |
| Strong Sell | 3 |
Factor Grades
| Factor | Grade |
|---|
| Valuation | D+ |
| Growth | A |
| Profitability | D |
| Momentum | A |
| Revisions | C- |
Valuation Measures
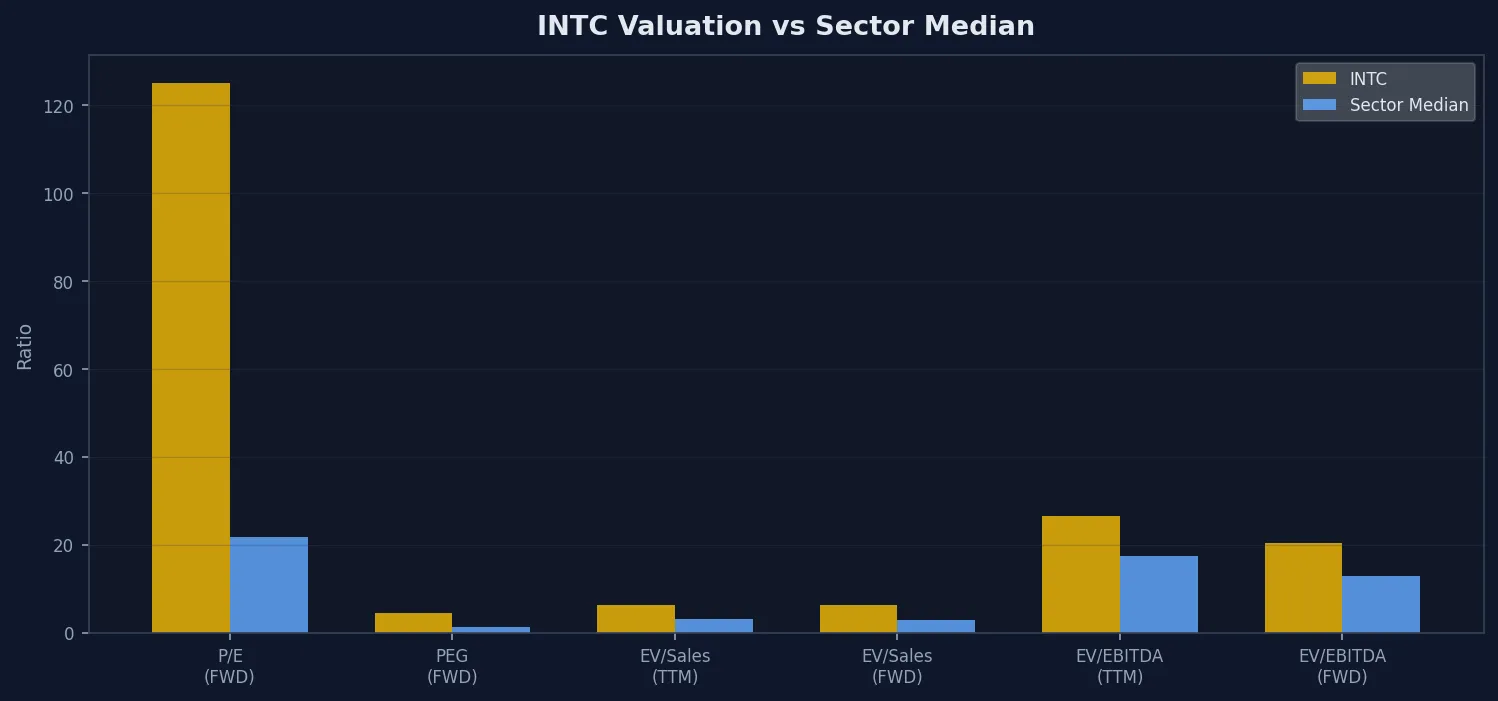
INTC Valuation Grade: D+
| Metric | Grade | INTC | Sector Median | % Diff. to Sector | INTC 5Y Avg. | % Diff. to 5Y Avg. |
|---|
| P/E Non-GAAP (FWD) | F | 125.09 | 21.64 | 479.05% | 53.85 | 122.28% |
| P/E GAAP (TTM) | - | NM | 31.51 | NM | - | NM |
| P/E GAAP (FWD) | - | NM | 29.58 | - | - | NM |
| PEG GAAP (TTM) | - | NM | 0.92 | - | - | NM |
| PEG Non-GAAP (FWD) | - | 4.48 | 1.36 | 229.03% | - | - |
| EV / Sales (TTM) | D+ | 6.33 | 3.15 | 100.72% | 2.87 | 120.35% |
| EV / Sales (FWD) | D+ | 6.22 | 2.81 | 121.32% | 2.97 | 109.17% |
| EV / EBITDA (TTM) | C- | 26.48 | 17.43 | 51.89% | 13.21 | 100.46% |
| EV / EBITDA (FWD) | D+ | 20.48 | 12.93 | 58.35% | 11.19 | 83.04% |
P/E & PEG Ratio
Price/Earnings Ratio
| Year | P/E Ratio |
|---|
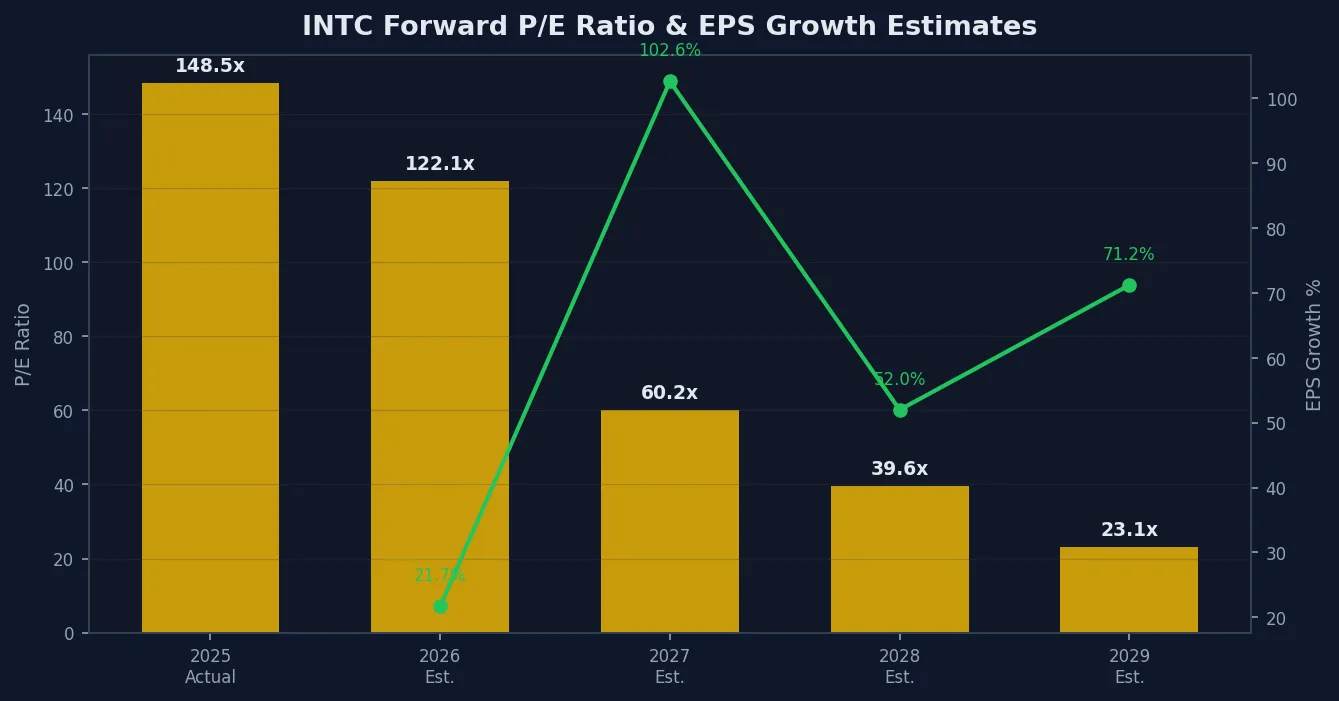
| 2025 Actual | 148.53 |
| 2026 Estimated | 122.07 |
| 2027 Estimated | 60.24 |
| 2028 Estimated | 39.63 |
| 2029 Estimated | 23.15 |
Consensus EPS Estimate Growth Rate
| Fiscal Year | Growth Rate |
|---|
| Dec 2026 | 21.67% |
| Dec 2027 | 102.64% |
| Dec 2028 | 51.99% |
| Dec 2029 | 71.23% |
Earnings Summary
Latest Quarter’s Earnings (1/22/2026)
| Metric | Value |
|---|
| EPS Normalized Actual | $0.18 (Beat by $0.01) |
| EPS GAAP Actual | -$0.12 (Miss by -$0.03) |
| Revenue Actual | $13.67B |
| Revenue Surprise | Beat by $282.46M |
Upcoming Quarter’s Earnings (4/23/2026)
| Metric | Value |
|---|
| EPS Normalized Estimate | $0.01 |
| EPS GAAP Estimate | -$0.19 |
| Revenue Estimate | $12.36B |
| EPS Revisions (Last 90 Days) | ▲ 6 / ▼ 24 |
Revisions Grade: C-
| Metric | INTC | Sector Median | % Diff. to Sector | INTC 5Y Avg. | % Diff. to 5Y Avg. |
|---|
| FY1 Up Revisions (90d) | 13 (34.21%) | 66.33% | -48.42% | 34.93% | -2.06% |
| FY1 Down Revisions (90d) | 25 (65.79%) | 32.94% | 99.75% | 65.07% | 1.11% |
Earnings Estimates
Annual Estimates Summary
| Fiscal Period Ending | Consensus EPS Estimate | Consensus Revenue Estimate |
|---|
| Dec 2026 | $0.51 | $54.10B |
Annual EPS Estimates
| Fiscal Period | EPS Estimate | YoY Growth | Forward P/E | Low | High | # of Analysts |
|---|
| Dec 2026 | $0.51 | 21.67% | 122.07 | $0.28 | $1.00 | 40 |
| Dec 2027 | $1.04 | 102.64% | 60.24 | $0.50 | $2.00 | 41 |
Annual Revenue Estimates
| Fiscal Period | Revenue Estimate | Forward P/S | Low | High | # of Analysts |
|---|
| Dec 2026 | $54.10B | 5.79 | $51.34B | $60.57B | 41 |
Consensus EPS Revision Trend
| Fiscal Period | EPS Estimate | YoY Growth | 1M Trend | 3M Trend | 6M Trend |
|---|
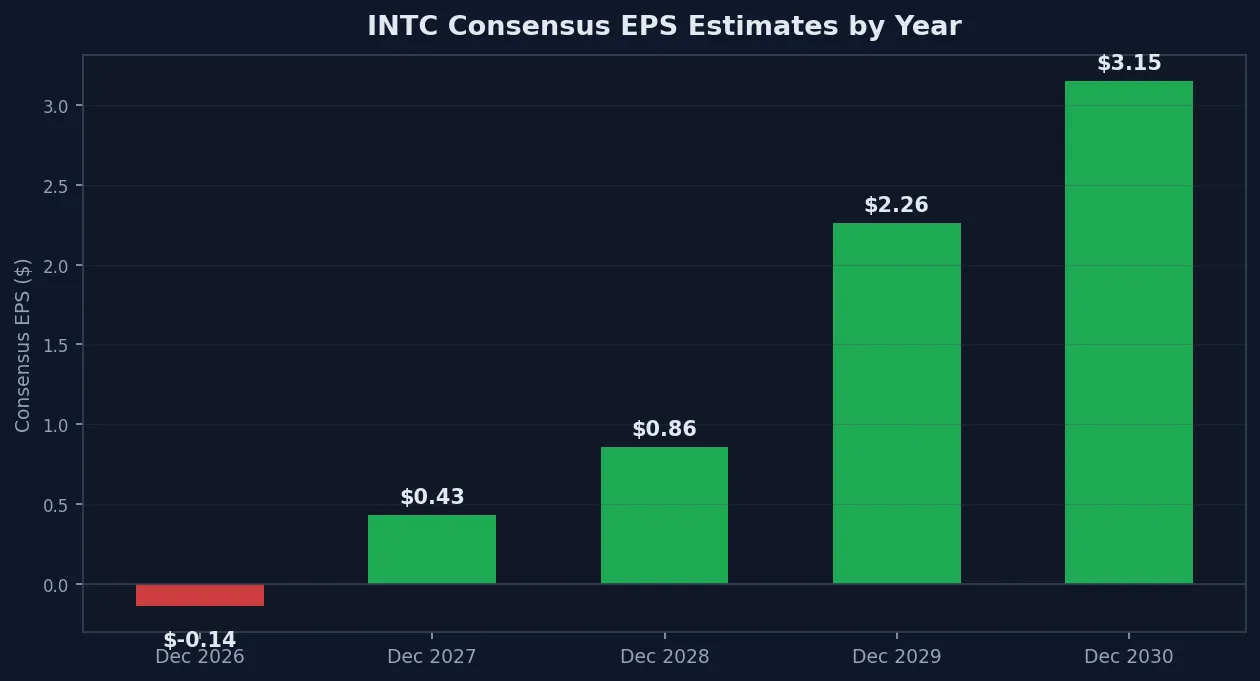
| Dec 2026 | -$0.14 | NM | 6.33% | NM | NM |
| Dec 2027 | $0.43 | NM | -16.04% | - | -8.77% |
| Dec 2028 | $0.86 | 99.95% | 9.54% | -40.69% | -53.00% |
| Dec 2029 | $1.26 | 162.77% | 0.00% | -13.41% | -13.74% |
| Dec 2030 | $3.15 | 39.38% | 0.00% | - | - |
Earnings Surprise
Earnings Surprise Summary (Quarterly, Last 2 Years)
| Metric | Count |
|---|
| EPS # of Beats | 4 |
| EPS # of Misses | 4 |
| EPS # of In-lines | 0 |
| Revenue # of Beats | 6 |
| Revenue # of Misses | 2 |
| Revenue # of In-lines | 0 |
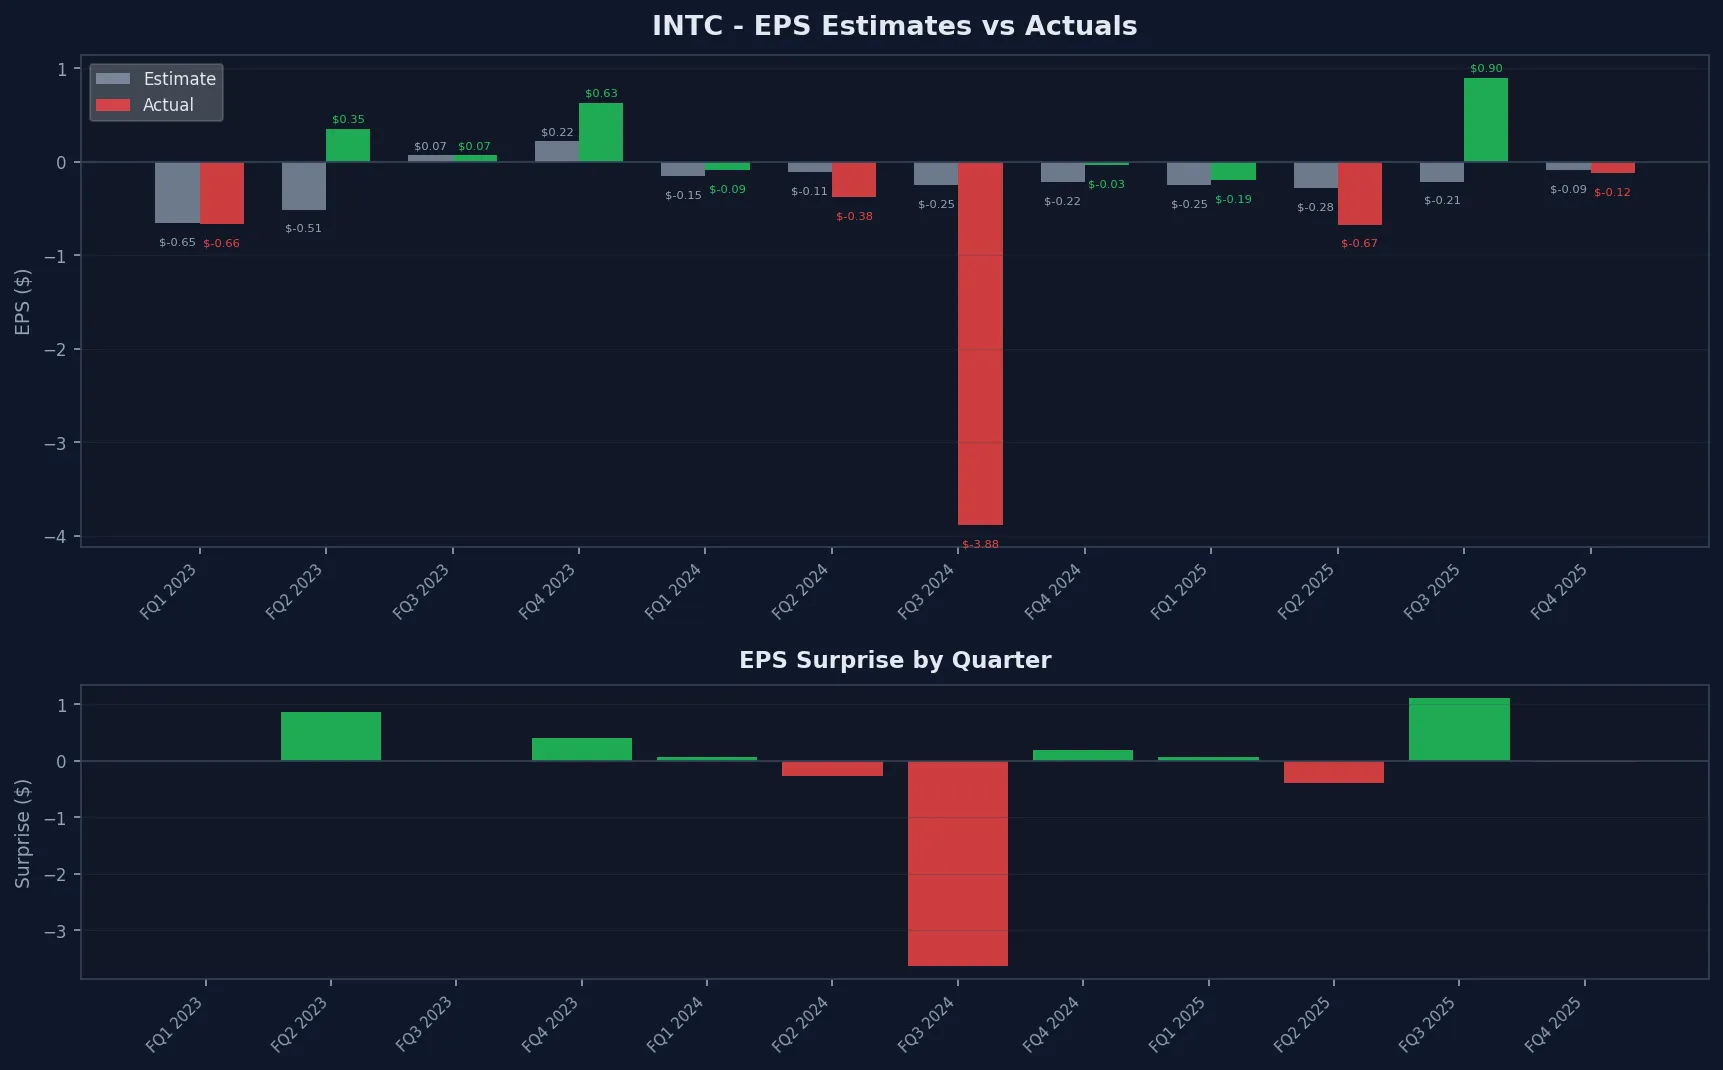
Quarterly EPS Surprise History
| Earnings Date | EPS Estimate | EPS Actual | Surprise | Surprise % |
|---|
| FQ4 2025 (Dec 2025) | -$0.09 | -$0.12 | -$0.03 | -27.81% |
| FQ3 2025 (Sep 2025) | -$0.21 | $0.90 | +$1.11 | NM |
| FQ2 2025 (Jun 2025) | -$0.28 | -$0.67 | -$0.39 | -139.93% |
| FQ1 2025 (Mar 2025) | -$0.25 | -$0.19 | +$0.06 | 23.55% |
| FQ4 2024 (Dec 2024) | -$0.22 | -$0.03 | +$0.19 | 86.53% |
| FQ3 2024 (Sep 2024) | -$0.25 | -$3.88 | -$3.63 | -1,422.64% |
| FQ2 2024 (Jun 2024) | -$0.11 | -$0.38 | -$0.27 | - |
| FQ1 2024 (Mar 2024) | -$0.15 | -$0.09 | +$0.05 | 37.93% |
| FQ4 2023 (Dec 2023) | $0.22 | $0.63 | +$0.41 | 182.38% |
| FQ3 2023 (Sep 2023) | $0.07 | $0.07 | -$0.00 | -4.74% |
| FQ2 2023 (Jun 2023) | -$0.51 | $0.35 | +$0.86 | NM |
| FQ1 2023 (Mar 2023) | -$0.65 | -$0.66 | -$0.01 | -0.91% |
Risk & Return Metrics
Based on ~504 trading days of close price data (daily returns, annualized using 252 trading days).
| Metric | Daily | Annualized |
|---|
| Expected Return | 0.1285% | 38.10% |
| Risk (Std Dev) | 3.2100% | 50.93% |
| Metric | Value |
|---|
| First Price (USD) | $34.00 |
| Last Price (USD) | $65.18 |
| Total Return | 91.71% |
Key Metrics & Risk
Based on 1256 trading days of close price data (daily returns, annualized using 252 trading days).
| Metric | Value |
|---|
| Latest Price | $99.17 |
| Day Change | $-12.61 (-11.28%) |
| 52-Week High | $106.48 |
| 52-Week Low | $98.33 |
| Volume | 144,388,800 |
| Metric | Daily | Annualized |
|---|
| Expected Return | 0.1040% | 29.94% |
| Risk (Std Dev) | 3.2645% | 51.82% |
| Total Return (period) | 89.82% |
| First Price | $52.24 |
| Period | 1256 days (start to 2026-06-05) |
Fundamentals
| Metric | Value |
|---|
| Market Cap | 537.98B |
| Enterprise Value | 563.82B |
| Forward P/E | 69.6 |
| Price to Book | 4.83 |
| Price to Sales | 10.01 |
| EV/Revenue | 10.49 |
| EV/EBITDA | 39.78 |
| Profitability | |
| Profit Margin | -5.9% |
| Operating Margin | 6.88% |
| ROE | -2.91% |
| ROA | 0.63% |
| Growth | |
| Revenue Growth | 7.2% |
| Financial Health | |
| Total Revenue | 53.76B |
| Total Debt | 45.03B |
| Total Cash | 32.79B |
| Free Cash Flow | -8.3B |
| Operating Cash Flow | 9.98B |
| Price & Technical | |
| 52W High | $132.75$ |
| 52W Low | $18.97$ |
| 50-Day Avg | $91.38$ |
| 200-Day Avg | $52.13$ |
| Beta | 2.23 |
| Shares Outstanding | 5.03B |
| Float Shares | 5.02B |
| Insider Holdings | 14.72% |
| Institutional Holdings | 64.04% |
| Short Ratio | 0.92 |
| Short % of Float | 2.69% |
| Analyst Targets | |
| Target High | $150.0$ |
| Target Low | $45.0$ |
| Target Mean | $92.17$ |
| Target Median | $90.0$ |
| # of Analysts | 41 |
| Recommendation | hold |