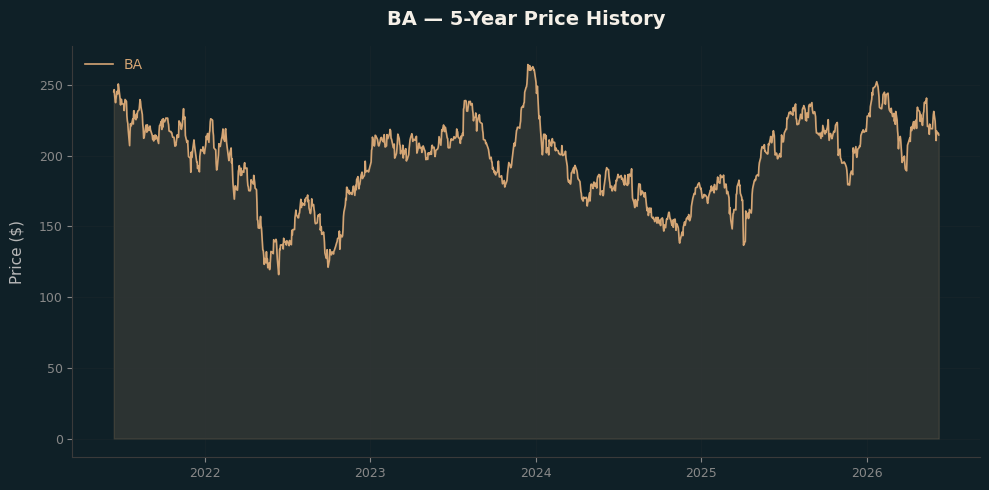
Boeing (BA) is a aerospace & defense company in the Industrials sector. Listed on the NASDAQ, Boeing is a component of the S&P 500 index. As of 2026-06-10, the stock is trading at $209.00.
Key Metrics & Risk
Based on 5-year historical data from Yahoo Finance (daily returns, annualized using 252 trading days).
| Metric | Value |
|---|---|
| Latest Price | $209.00 |
| Latest Date | 2026-06-10 |
| Expected Return (Annualized) | 3.28% |
| Risk / Std Dev (Annualized) | 36.50% |
| Sharpe Ratio (rf=4.5%) | -0.03 |
S&P 500 Context
- Sector: Industrials
- Sub-Industry: Aerospace & Defense
- Exchange: NASDAQ
- Index: S&P 500 Component
Risk/Return Profile
The stock shows an annualized expected return of 3.28% with an annualized volatility of 36.50%. The Sharpe ratio of -0.03 (assuming 4.5% risk-free rate) indicates negative risk-adjusted returns relative to the risk-free rate.
Modern Portfolio Theory Positioning
This stock is plotted on the S&P 500 Modern Portfolio Theory chart which visualizes the risk/return trade-off across all S&P 500 components. The chart uses Sharpe ratio as the color dimension, allowing quick identification of stocks with superior risk-adjusted performance.
Fundamentals
| Metric | Value |
|---|---|
| Market Cap | 164.76B |
| Enterprise Value | 194.2B |
| Trailing P/E | 84.62 |
| Forward P/E | 49.98 |
| Price to Book | 27.53 |
| Price to Sales | 1.79 |
| EV/Revenue | 2.11 |
| EV/EBITDA | -59.59 |
| Profitability | | | Profit Margin | 2.46% | | Operating Margin | 1.71% | | ROE | 169.95% | | ROA | -2.07% |
| Growth | | | Revenue Growth | 14.0% |
| Financial Health | | | Total Revenue | 92.18B | | Total Debt | 49.61B | | Total Cash | 20.18B | | Free Cash Flow | 2.55B | | Operating Cash Flow | 2.5B |
| Price & Technical | | | 52W High | $254.35$ | | 52W Low | $176.77$ | | 50-Day Avg | $222.06$ | | 200-Day Avg | $219.04$ | | Beta | 1.2 | | Shares Outstanding | 0.79B | | Float Shares | 0.76B | | Insider Holdings | 0.05% | | Institutional Holdings | 75.4% | | Short Ratio | 0.08 | | Short % of Float | 0.07% |
| Analyst Targets | | | Target High | $300.0$ | | Target Low | $230.0$ | | Target Mean | $270.0$ | | Target Median | $275.0$ | | # of Analysts | 25 | | Recommendation | buy |
Disclaimer
This analysis is for educational purposes only and does not constitute financial advice. Past performance is not indicative of future results. Always conduct your own research or consult a qualified financial advisor before making investment decisions.