Packaging Corporation of America (PKG) is a paper & plastic packaging products & materials company in the Materials sector. Listed on the NASDAQ, Packaging Corporation of America is a component of the S&P 500 index. As of 2026-06-10, the stock is trading at $216.64.
Key Metrics & Risk
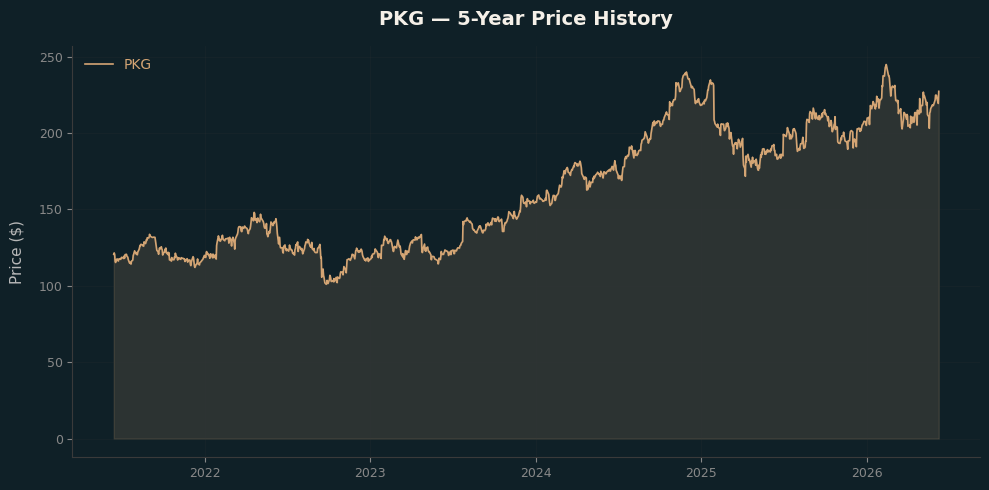
Based on 5-year historical data from Yahoo Finance (daily returns, annualized using 252 trading days).
| Metric | Value |
|---|---|
| Latest Price | $216.64 |
| Latest Date | 2026-06-10 |
| Expected Return (Annualized) | 14.45% |
| Risk / Std Dev (Annualized) | 25.48% |
| Sharpe Ratio (rf=4.5%) | 0.39 |
S&P 500 Context
- Sector: Materials
- Sub-Industry: Paper & Plastic Packaging Products & Materials
- Exchange: NASDAQ
- Index: S&P 500 Component
Risk/Return Profile
The stock shows an annualized expected return of 14.45% with an annualized volatility of 25.48%. The Sharpe ratio of 0.39 (assuming 4.5% risk-free rate) indicates below-average risk-adjusted returns relative to the risk-free rate.
Modern Portfolio Theory Positioning
This stock is plotted on the S&P 500 Modern Portfolio Theory chart which visualizes the risk/return trade-off across all S&P 500 components. The chart uses Sharpe ratio as the color dimension, allowing quick identification of stocks with superior risk-adjusted performance.
Fundamentals
| Metric | Value |
|---|---|
| Market Cap | 19.3B |
| Enterprise Value | 23.01B |
| Trailing P/E | 26.32 |
| Forward P/E | 17.68 |
| Price to Book | 4.18 |
| Price to Sales | 2.09 |
| EV/Revenue | 2.5 |
| EV/EBITDA | 11.72 |
| Profitability | | | Profit Margin | 8.04% | | Operating Margin | 13.45% | | ROE | 16.31% | | ROA | 8.37% |
| Growth | | | Revenue Growth | 10.6% | | Earnings Growth | -15.5% |
| Dividend | | | Dividend Yield | 277.0% | | Payout Ratio | 60.75% | | 5Y Avg Yield | 282.0% |
| Financial Health | | | Total Revenue | 9.22B | | Total Debt | 4.37B | | Total Cash | 0.54B | | Free Cash Flow | 0.39B | | Operating Cash Flow | 1.55B |
| Price & Technical | | | 52W High | $249.51$ | | 52W Low | $184.76$ | | 50-Day Avg | $215.25$ | | 200-Day Avg | $213.73$ | | Beta | 0.83 | | Shares Outstanding | 0.09B | | Float Shares | 0.09B | | Insider Holdings | 1.62% | | Institutional Holdings | 99.94% | | Short Ratio | 5.34 | | Short % of Float | 5.07% |
| Analyst Targets | | | Target High | $258.0$ | | Target Low | $167.0$ | | Target Mean | $235.9$ | | Target Median | $245.5$ | | # of Analysts | 10 | | Recommendation | buy |
Disclaimer
This analysis is for educational purposes only and does not constitute financial advice. Past performance is not indicative of future results. Always conduct your own research or consult a qualified financial advisor before making investment decisions.