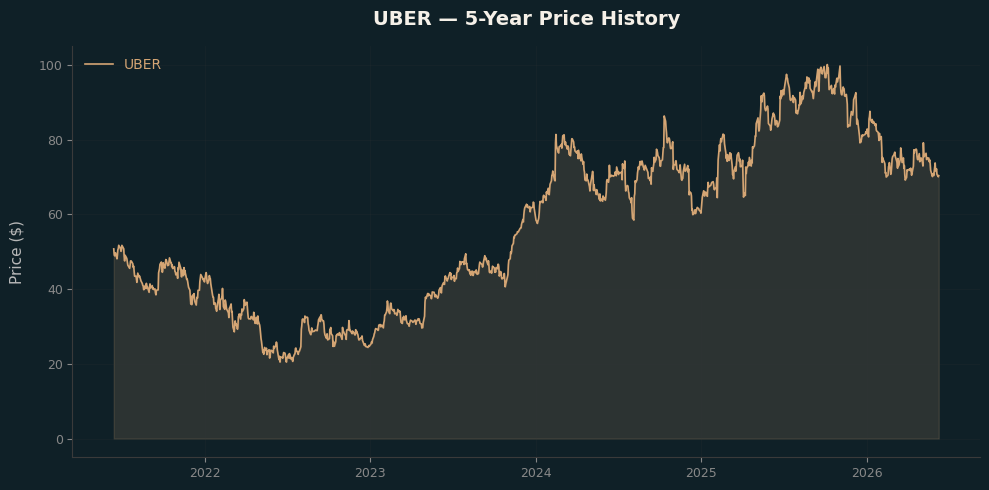
Uber (UBER) is a passenger ground transportation company in the Industrials sector. Listed on the NASDAQ, Uber is a component of the S&P 500 index. As of 2026-06-10, the stock is trading at $68.61.
Key Metrics & Risk
Based on 5-year historical data from Yahoo Finance (daily returns, annualized using 252 trading days).
| Metric | Value |
|---|---|
| Latest Price | $68.61 |
| Latest Date | 2026-06-10 |
| Expected Return (Annualized) | 16.31% |
| Risk / Std Dev (Annualized) | 44.85% |
| Sharpe Ratio (rf=4.5%) | 0.26 |
S&P 500 Context
- Sector: Industrials
- Sub-Industry: Passenger Ground Transportation
- Exchange: NASDAQ
- Index: S&P 500 Component
Risk/Return Profile
The stock shows an annualized expected return of 16.31% with an annualized volatility of 44.85%. The Sharpe ratio of 0.26 (assuming 4.5% risk-free rate) indicates below-average risk-adjusted returns relative to the risk-free rate.
Modern Portfolio Theory Positioning
This stock is plotted on the S&P 500 Modern Portfolio Theory chart which visualizes the risk/return trade-off across all S&P 500 components. The chart uses Sharpe ratio as the color dimension, allowing quick identification of stocks with superior risk-adjusted performance.
Fundamentals
| Metric | Value |
|---|---|
| Market Cap | 139.66B |
| Enterprise Value | 147.05B |
| Trailing P/E | 17.02 |
| Forward P/E | 15.7 |
| Price to Book | 5.65 |
| Price to Sales | 2.6 |
| EV/Revenue | 2.74 |
| EV/EBITDA | 20.95 |
| Profitability | | | Profit Margin | 15.91% | | Operating Margin | 14.56% | | ROE | 35.31% | | ROA | 6.94% |
| Growth | | | Revenue Growth | 14.5% | | Earnings Growth | -84.6% |
| Financial Health | | | Total Revenue | 53.69B | | Total Debt | 12.42B | | Total Cash | 6.09B | | Free Cash Flow | 6.54B | | Operating Cash Flow | 10.13B |
| Price & Technical | | | 52W High | $101.99$ | | 52W Low | $68.46$ | | 50-Day Avg | $73.63$ | | 200-Day Avg | $82.93$ | | Beta | 1.12 | | Shares Outstanding | 2.04B | | Float Shares | 2.02B | | Insider Holdings | 0.45% | | Institutional Holdings | 86.22% | | Short Ratio | 3.07 | | Short % of Float | 3.12% |
| Analyst Targets | | | Target High | $150.0$ | | Target Low | $70.0$ | | Target Mean | $104.43$ | | Target Median | $106.9$ | | # of Analysts | 50 | | Recommendation | strong_buy |
Disclaimer
This analysis is for educational purposes only and does not constitute financial advice. Past performance is not indicative of future results. Always conduct your own research or consult a qualified financial advisor before making investment decisions.