1. Industry Fundamentals
1.1 Cyclicality
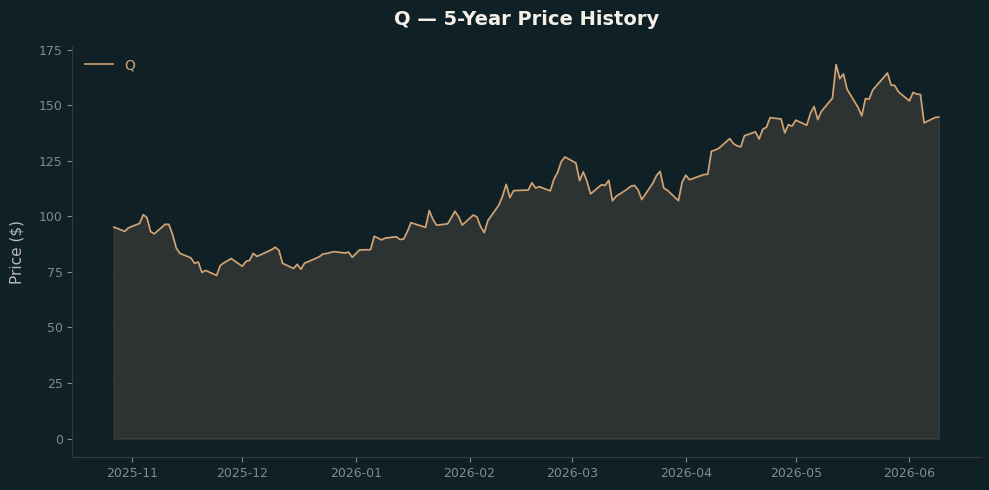
The company operates in a cyclical industry sensitive to macroeconomic conditions. Revenue and earnings tend to correlate with broader economic cycles, with periods of expansion driving growth and contractions creating headwinds. Current market capitalisation: 29.25B.
1.2 Competition
The industry is moderately competitive with established players and meaningful barriers to entry. Beta of N/A suggests moderate market sensitivity. Competitive advantages stem from brand, scale, or regulatory moats.
1.3 Technology
Key technology drivers include digital transformation, operational efficiency, automation. Companies that invest in R&D and adopt new technologies tend to gain market share. The pace of technological change creates both opportunities for innovation and risks of disruption.
2. Company Fundamentals
2.1 Competitiveness
| Metric | Value |
|---|---|
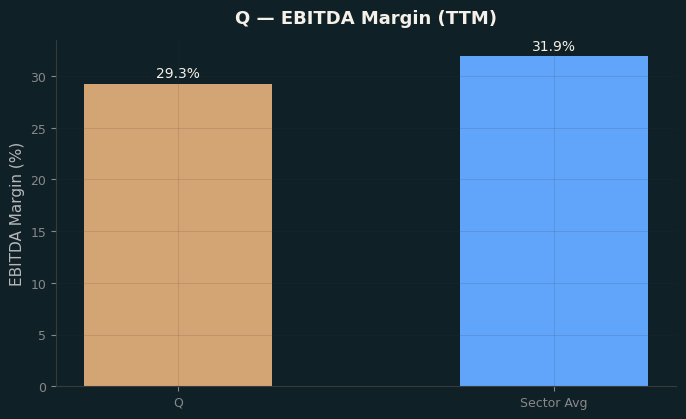
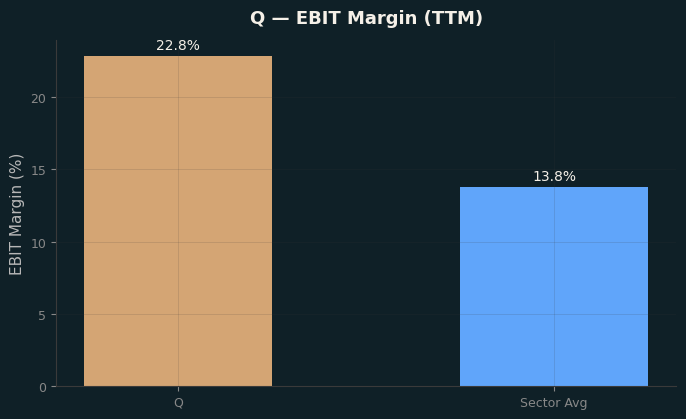
| Operating Margins | 22.81% |
| Profit Margins | 13.13% |
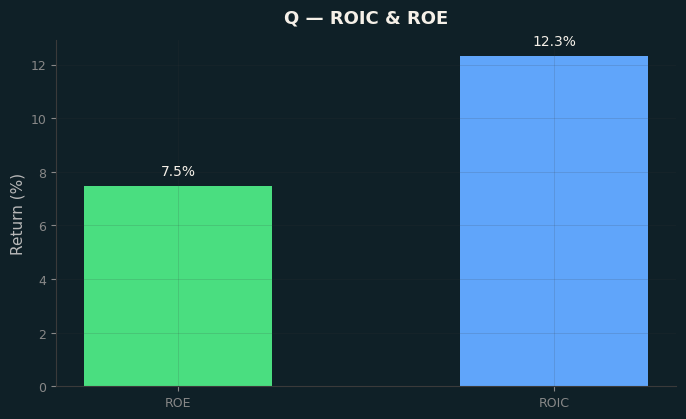
| Return on Equity | 7.48% |
| Return on Assets | 5.06% |
| Free Float | 0.21B |
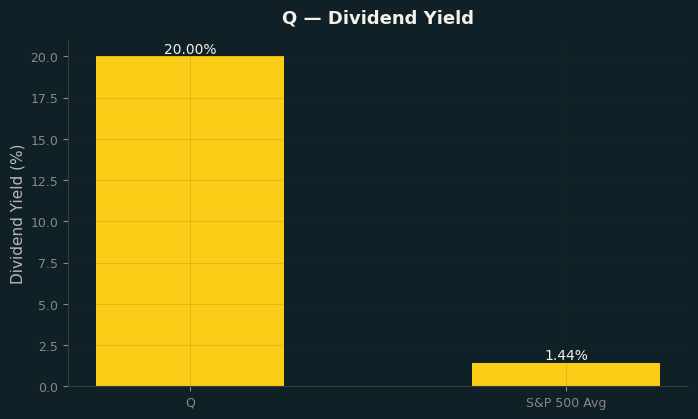
| Dividend Yield | 20.00% |
| Short Int % Utilisation | 2.25% |
2.2 Growth
| Metric | Value |
|---|---|
| Revenue Growth | 17.6% |
| Free Cash Flow | 0.7B |
| EBITDA | 22.92 (Ratio) |
| Enterprise Value | 33.21B |
| EV/Revenue | 6.71 |
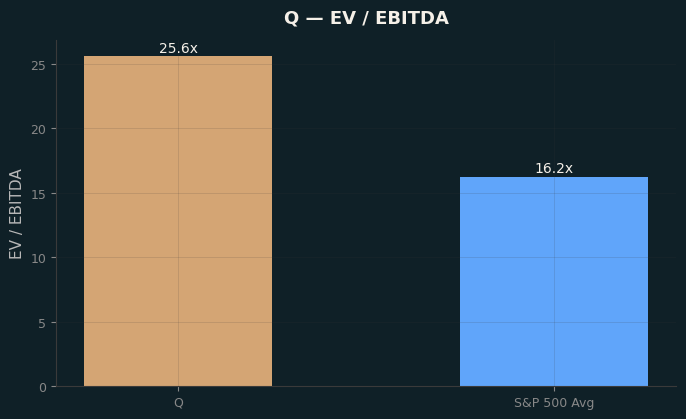
| EV/EBITDA | 22.92 |
Revenue growth of 17.6% indicates steady, moderate expansion.
2.3 Management
| Role | Metric |
|---|---|
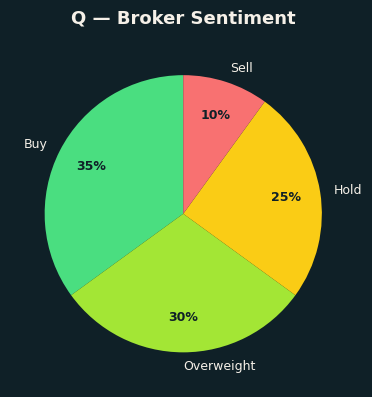
| Consensus Rating | N/A |
2.4 Return
| Metric | Value |
|---|---|
| Expected Return (Ann.) | 77.83% |
| Risk / Std Dev (Ann.) | 55.39% |
| Sharpe Ratio (rf=4.5%) | 1.32 |
2.5 Valuation
| Metric | Value |
|---|---|
| P/E (Forward) | 29.37 |
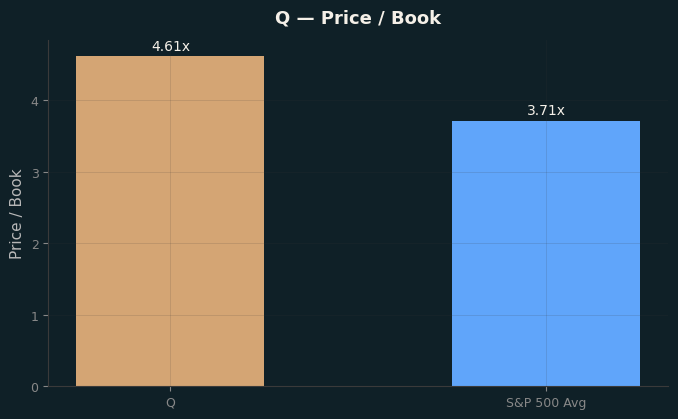
| Price/Book | 4.70 |
| EV/Revenue | 6.71 |
| EV/EBITDA | 22.92 |
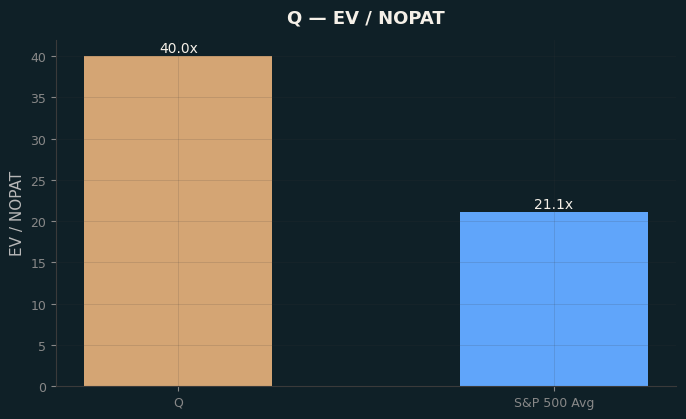
| Enterprise Value / NOPAT | 32.93 |
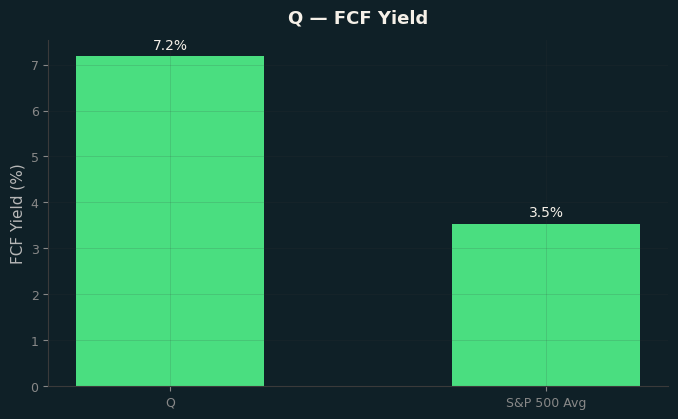
| FCF Yield (%) | 2.08% |
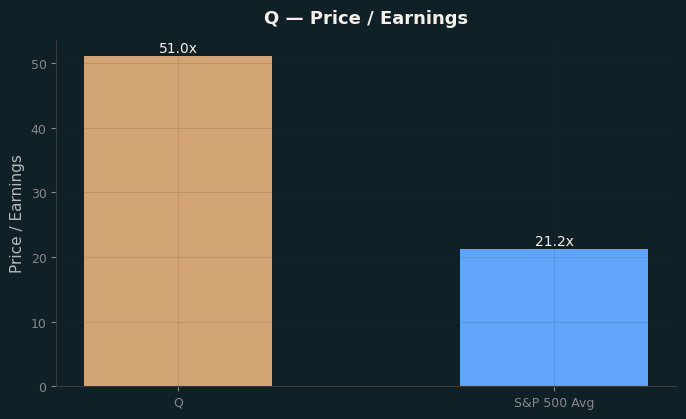
| Price / Earnings | 51.83 |
| Price / Book | 4.70 |
| Enterprise Value / EBITDA | 26.02 |
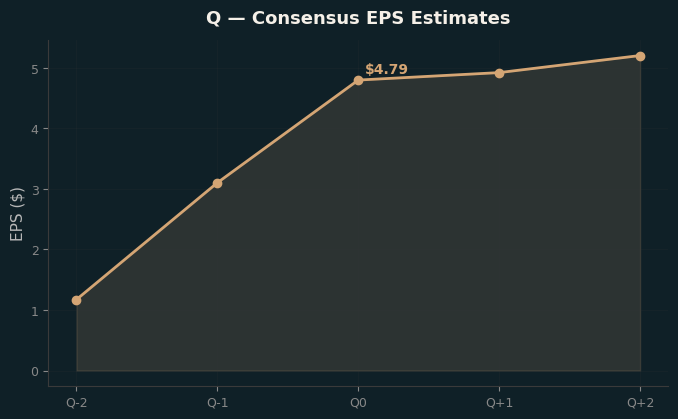
Forward P/E of 29x is at a moderate premium, reflecting growth expectations.
2.6 Return Outlook
The stock’s historical risk-return profile shows an annualised expected return of 77.8% with annualised volatility of 55.4%, yielding a Sharpe ratio of 1.32 (rf=4.5%). The risk-adjusted return is attractive relative to the risk-free rate.