1. Industry Fundamentals
1.1 Cyclicality
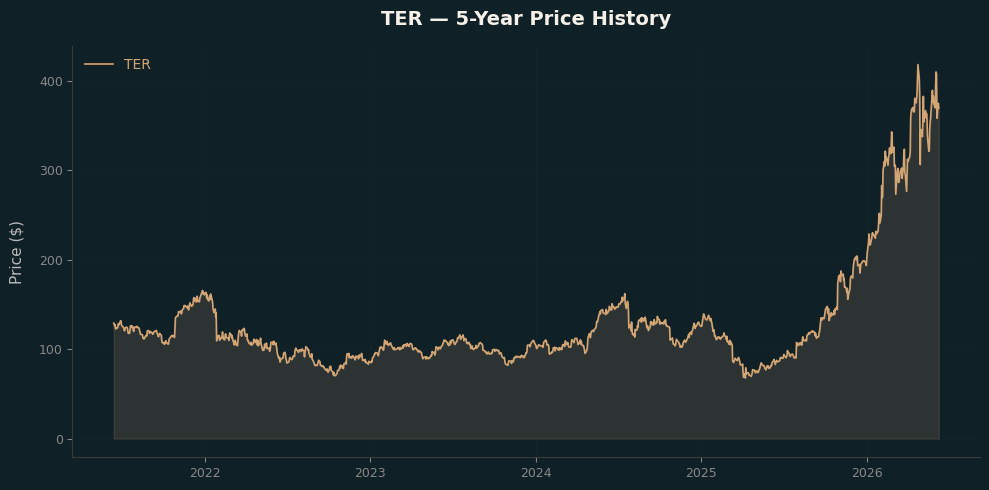
The company operates in a cyclical industry sensitive to macroeconomic conditions. Revenue and earnings tend to correlate with broader economic cycles, with periods of expansion driving growth and contractions creating headwinds. Current market capitalisation: 54.41B.
1.2 Competition
The industry is highly competitive with low barriers to entry and significant rivalry among existing players. Beta of 1.79 reflects elevated volatility from competitive dynamics. Companies compete on pricing, innovation, and scale.
1.3 Technology
Key technology drivers include digital transformation, operational efficiency, automation. Companies that invest in R&D and adopt new technologies tend to gain market share. The pace of technological change creates both opportunities for innovation and risks of disruption.
2. Company Fundamentals
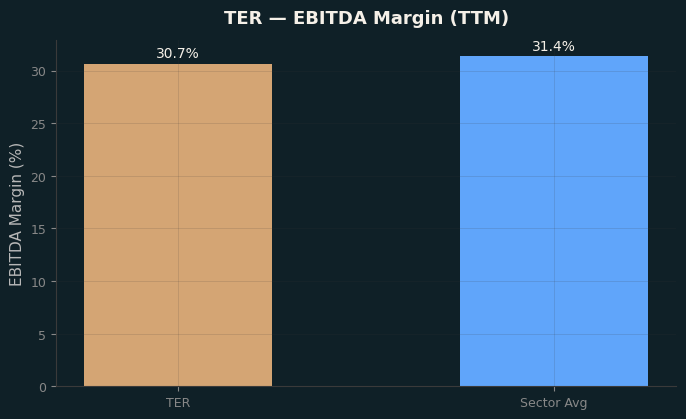
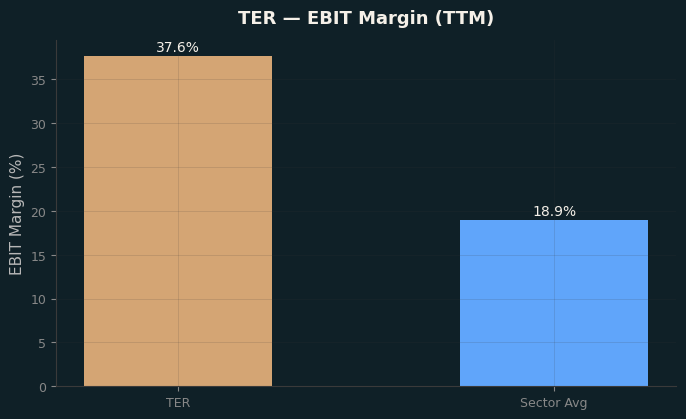
2.1 Competitiveness
| Metric | Value |
|---|---|
| Operating Margins | 37.61% |
| Profit Margins | 22.55% |
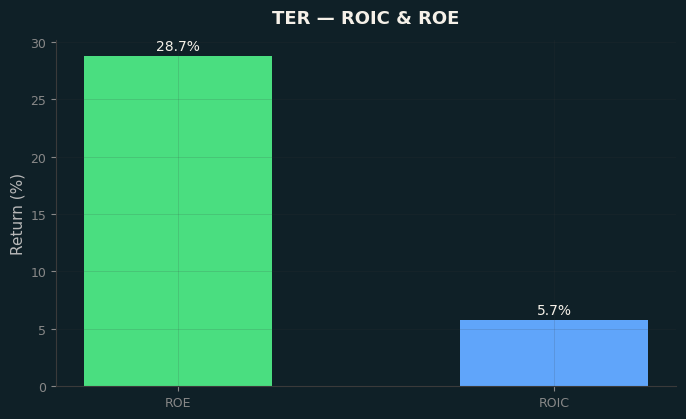
| Return on Equity | 28.75% |
| Return on Assets | 15.83% |
| Free Float | 0.16B |
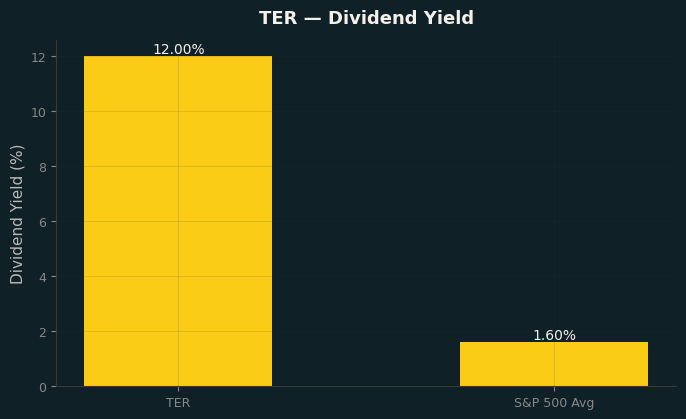
| Dividend Yield | 15.0% |
| Short Int % Utilisation | 5.08% |
2.2 Growth
| Metric | Value |
|---|---|
| Revenue Growth | 87.0% |
| Free Cash Flow | 0.3B |
| EBITDA | 46.71 (Ratio) |
| Enterprise Value | 54.25B |
| EV/Revenue | 14.33 |
| EV/EBITDA | 46.71 |
Revenue growth of 87.0% places the company in a high-growth category.
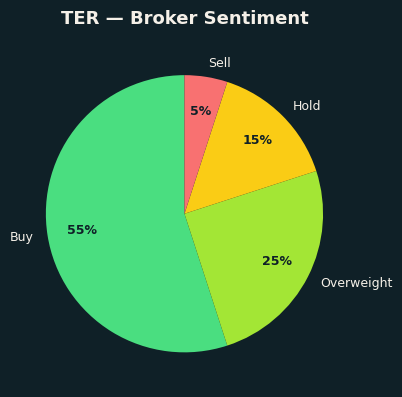
2.3 Management
| Role | Metric |
|---|---|
| Consensus Rating | N/A |
2.4 Return
| Metric | Value |
|---|---|
| Expected Return (Ann.) | 33.02% |
| Risk / Std Dev (Ann.) | 49.99% |
| Sharpe Ratio (rf=4.5%) | 0.57 |
| Beta | 1.79 |
2.5 Valuation
| Metric | Value |
|---|---|
| P/E (Forward) | 36.58 |
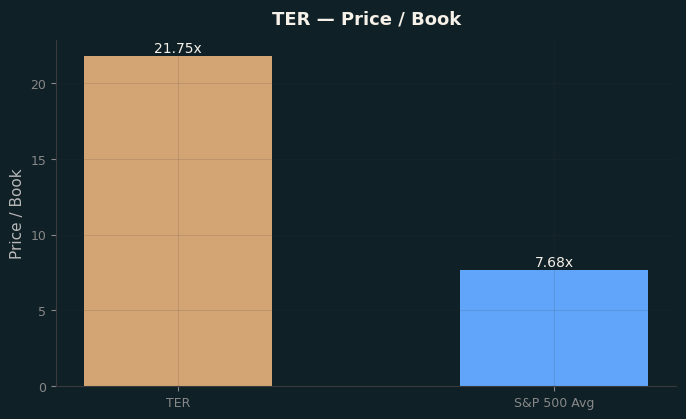
| Price/Book | 20.92 |
| EV/Revenue | 14.33 |
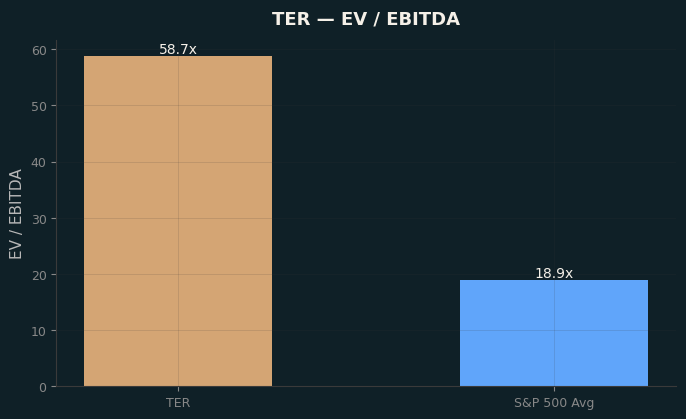
| EV/EBITDA | 46.71 |
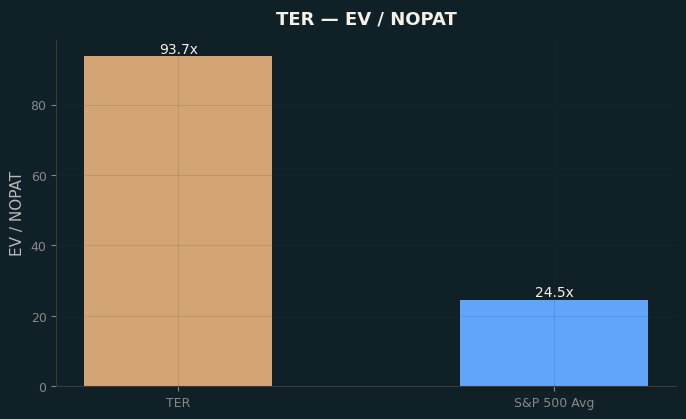
| Enterprise Value / NOPAT | 71.50 |
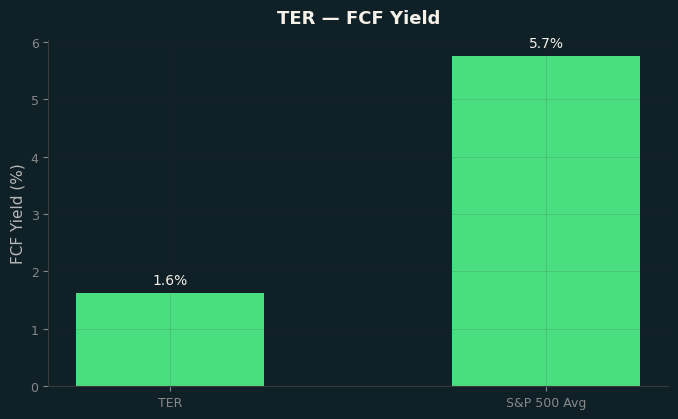
| FCF Yield (%) | 0.45% |
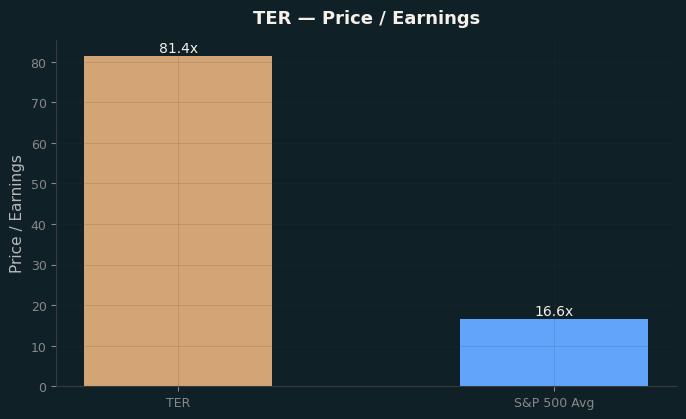
| Price / Earnings | 78.09 |
| Price / Book | 20.92 |
| Enterprise Value / EBITDA | 56.48 |
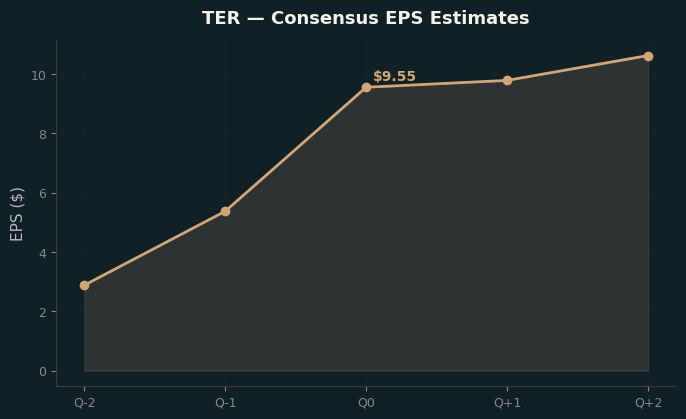
Forward P/E of 37x is at a moderate premium, reflecting growth expectations.
2.6 Return Outlook
The stock’s historical risk-return profile shows an annualised expected return of 33.0% with annualised volatility of 50.0%, yielding a Sharpe ratio of 0.57 (rf=4.5%). The risk-adjusted return is attractive relative to the risk-free rate. With a beta of 1.8, the stock is significantly more volatile than the market — it amplifies both upside and downside moves.