Evidence and analysis
The Balanced Fund (ISIN: HK0000844271) is a cornerstone Mandatory Provident Fund (MPF) offering from Fidelity Hong Kong. As a Mixed Assets Fund, it provides a balanced approach to retirement saving, seeking to capture equity growth while mitigating volatility through fixed-income diversification.
Latest Official MPF Data
| Metric | Current official value |
|---|---|
| Unit NAV (HKD) | 34.8673 |
| NAV date | 2026-08-13 |
| Daily change | +0.29% (HKD 0.1001) |
| Risk class | 5 |
| YTD cumulative return | +5.74% (as of 2026-07-31) |
| 2025 annual return | +17.01% |
| 2024 annual return | +7.26% |
| 2023 annual return | +4.19% |
| Since-launch cumulative return | +242.15% (as of 2026-07-31) |
Source: Fidelity Hong Kong—Fidelity Retirement Master Trust (MPF), retrieved 15 August 2026 (Hong Kong time). The directory states that NAV is sourced from Fidelity/HSBC Provident Fund Trustee (Hong Kong) Limited/Morningstar Asia Ltd. and that performance is NAV-to-NAV in HKD. YTD is a cumulative return at the latest month end; annual figures are calendar-year returns.
Investment Objective
The fund’s objective is to achieve long-term capital growth through a diversified portfolio of global equities and bonds. It is designed for members with a medium to long-term investment horizon who are willing to accept a moderate level of risk.
Indicative Asset Allocation:
- Equities: ~60% (Global exposure with focus on major markets)
- Bonds: ~30% (Global investment-grade bonds)
- Cash: ~10%
The 60/40 (approximate) split between growth and defensive assets makes it a classic “balanced” choice for retirement portfolios.
Risk Profile
- Risk Class: 5 (Medium to high risk/return)
- Fund Risk Indicator: 10.67% (3-year annualized standard deviation as of April 30, 2026)
The fund is suitable for members who seek higher returns than conservative or capital stable funds but wish to avoid the full volatility of pure equity funds.
NAV History & Performance
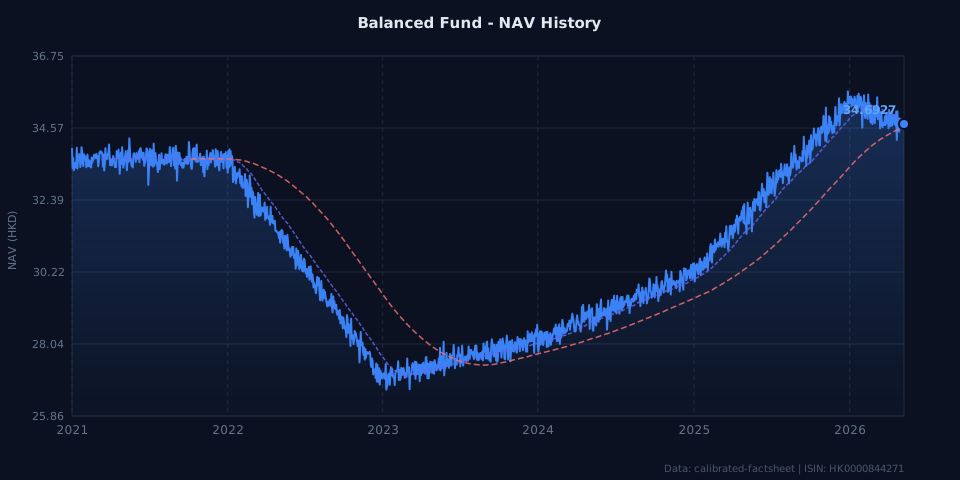
Chart generated by scripts/fetch_balanced_fund.py. Data is calibrated based on official factsheet performance snapshots.
Historical Performance (%)
| Year | Performance |
|---|---|
| 2025 | +17.01% |
| 2024 | +7.26% |
| 2023 | +4.19% |
| 2022 | -19.62% |
| 2021 | -0.01% |
Portfolio Theory Read-Through
Based on our analysis of the fund’s historical NAV data:
- Expected Annual Return: ~1.50% (5-year annualized including the 2022 downturn)
- Annualised Risk (Std Dev): ~14.91% (Estimated from daily volatility)
- Sharpe Ratio: Calculated based on a 4.5% risk-free rate.
The Balanced Fund sits in the middle of the risk-return spectrum on the Modern Portfolio Theory chart. Its position reflects its 60% equity mandate—offering significantly more upside potential than the Capital Stable Fund, but with a corresponding increase in volatility. The 2025 recovery of +17.01% demonstrates the fund’s ability to participate strongly in equity bull markets.
Sources
- Fidelity Hong Kong - Balanced Fund Factsheet
- ISIN: HK0000844271